- Office Hours: M-F 8:30 AM - 5:00 PM
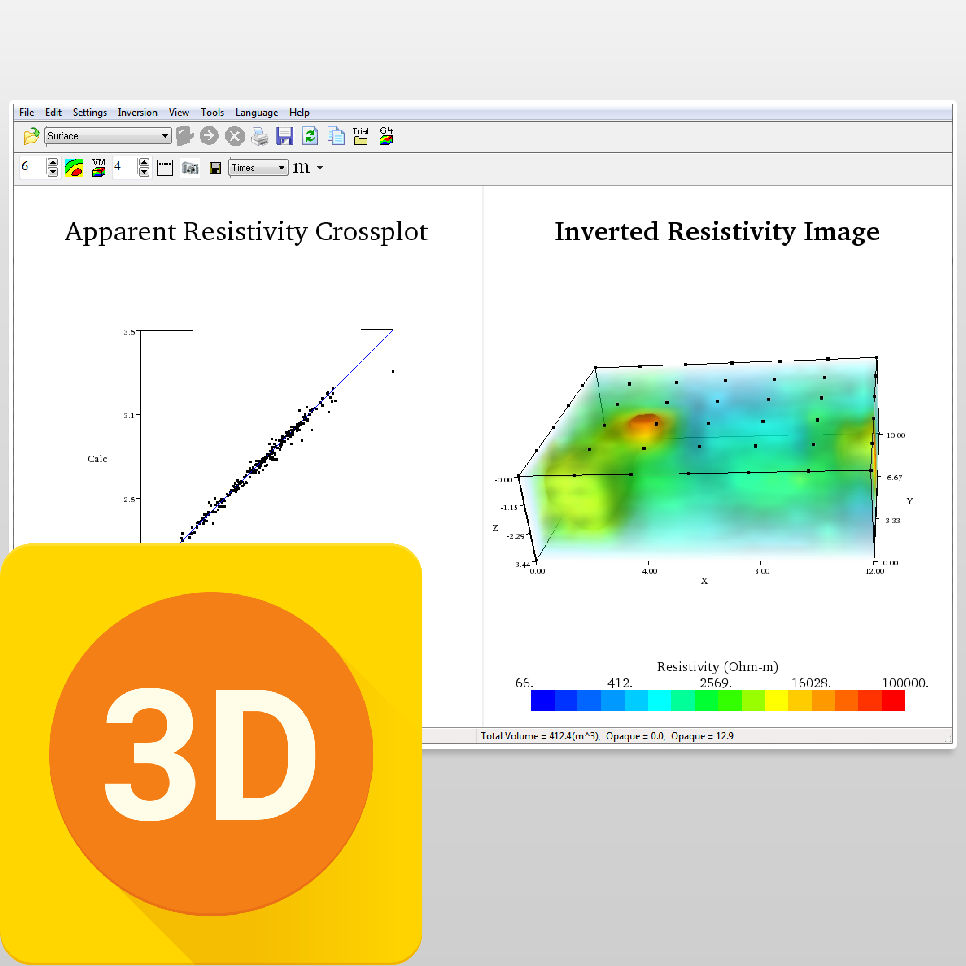
AGI EarthImager™ 3D is a three-dimensional resistivity and induced polarization (IP) inversion modeling software. It converts electrically gathered data and converts it into a 3D rendering presented using an advanced volume display.
EarthImager™ 3D is ideal for resistivity imaging—even in areas where there is a large topographic variation—without producing a noisy image. The final image can be rotated in any orientation, zoomed in and out, and translated to anywhere inside the image window in order to see the feature of interest in three-dimensional detail. It may show the shape of a hidden cave, the volume of a detected ore body, or the extent of an environmental spill plume.
EarthImager™ 3D is for use in geotechnical and geologic industries, including the following applications:
Outlining the shape of caves and voids.
Calculating the volume of caves and voids.
Visualizing the bedrock surface.
Pinpointing precise well location for groundwater exploration.
Outlining the shape of an ore body during mineral exploration.
Calculating the volume of an ore body during mineral exploration.
Mapping the extent of environmental spills.
Monitoring the progress of an environmental clean-up procedure.
Calculating volumes and extent of sand, gravel, or clay during aggregate mapping.
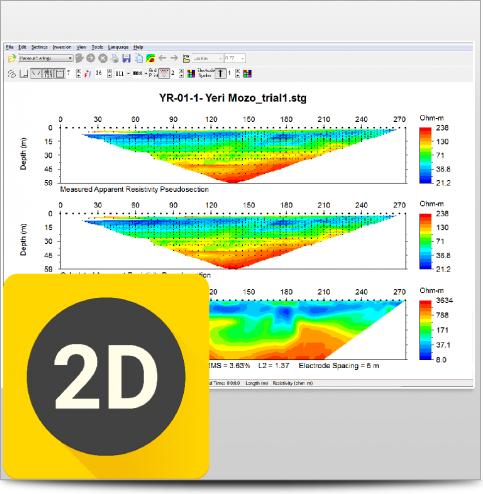
One example of AGI EarthImager™ 3D at work is when imaging a cave. If you discovered the cavern using 2D imaging software, you wouldn't be able to tell where you needed to drill in order to hit an exact location, as objects to the side of the 2D survey line gets “folded” in on the 2D image. This happens because the injected current does not simply flow downwards into the ground, but flows through the ground in all directions. 3D imaging does not have this limitation, as it can take spatial data and model the geometries in the correct location—reinsuring that your drilling location is exact and accurate for more precise projects.
User-friendly Windows GUI.
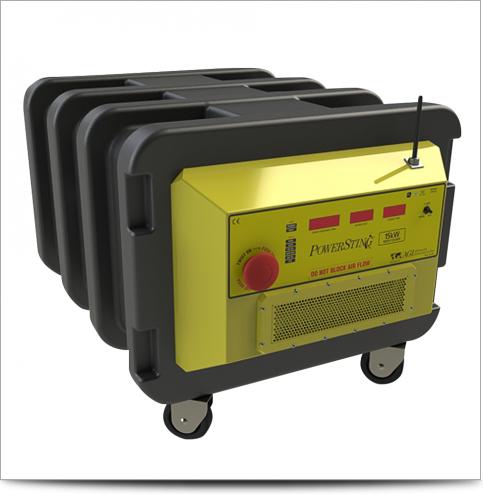
Seamless operation with AGI resistivity instruments.
Inversion Of 3D Surface Resistivity Data.
Inversion Of 3D Borehole Resistivity Data.
Inversion Of 3D IP Data.
3D Volumetric Rendering With Transparency Control.
Volume and multiple-slice images.
Interactive slice image.
No software limit on number of data points or number of electrodes.
No limit on array type or electrode location.
64-bit parallel processing capability with EarthImager3DCL module.
Data misfit cross-plot.
Finite difference forward modeling.
Options of boundary condition for forward modeling.
Smooth model inversion.
Noisy data suppression.
Trackable and retrievable user settings.
Tool buttons and popup menus for easy access to frequently used menu items.
Fast hardware-accelerated 3D graphics.
Windows true 24-bit color.
Inversion progress bar to show the inversion status.
Well-organized and hassle-free processing directory structure.
Saveable in bitmap, JPEG, PostScript, PNG, and TIFF file formats.
Saveable in XYZ format so it can be loaded into any off-shelf graphics software.
Convergence curve display.
User-specified minimum and maximum variable values of the image.
User-specified colors and contour levels.
This product is qualified for 100% financing. Learn more.

When you can see what you're working with below the surface, you can make better decisions that save you time and money.