- Office Hours: M-F 8:30 AM - 5:00 PM
Phuket Island, Thailand, is a popular tourist destination requiring significant water demand from the Thepkasattri watershed. As such, monitoring and managing the island's groundwater resources accurately is crucial to ensure sustainability throughout the seasons.
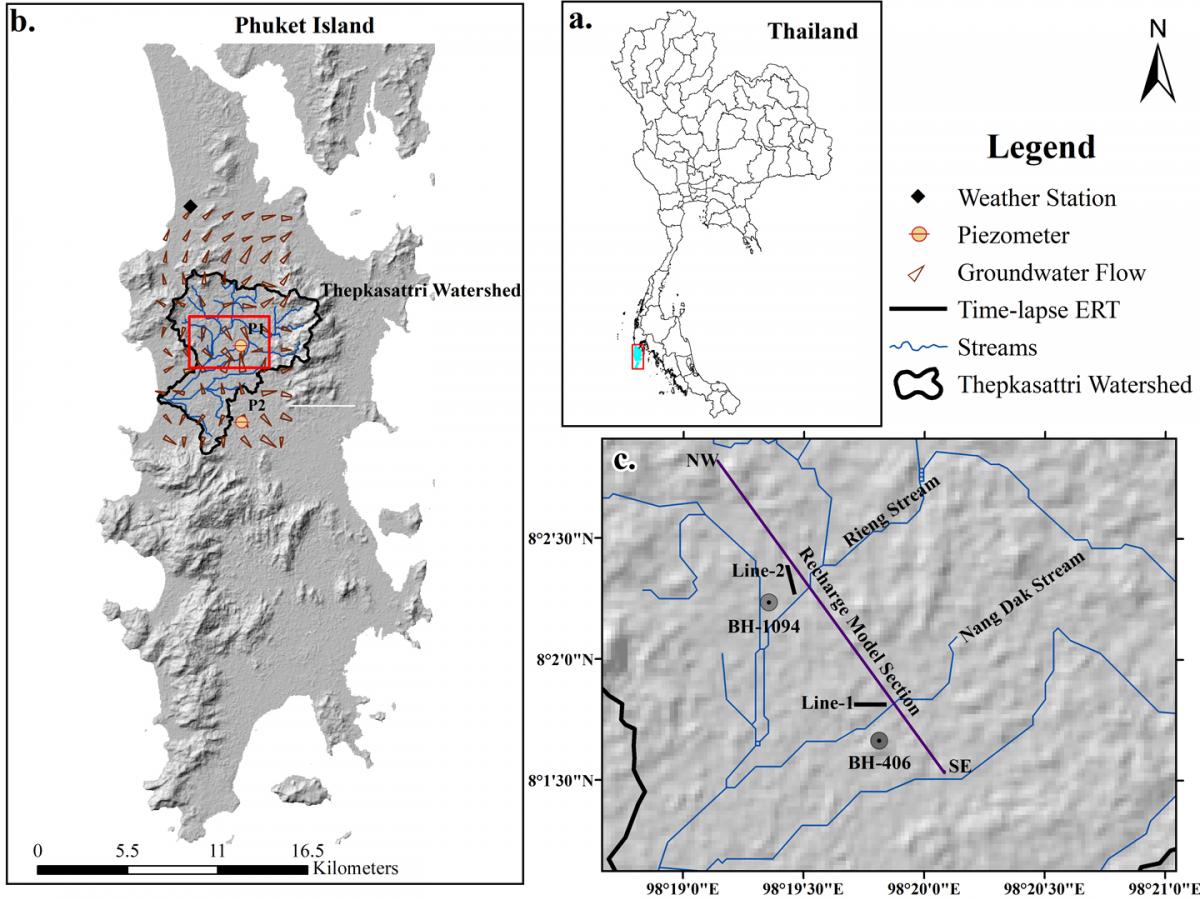
This study was conducted by a collaboration of university researchers from Prince of Songkla University and Eritrea Institute of Technology in Thailand to identify seasonal groundwater recharge mechanisms and visualize subsurface water movement and infiltration patterns through time-lapse electrical resistivity imaging (ERI).
The team hoped that the findings of this research would provide valuable insights for groundwater management strategies that can deal with seasonal variability and increasing water demand pressures.
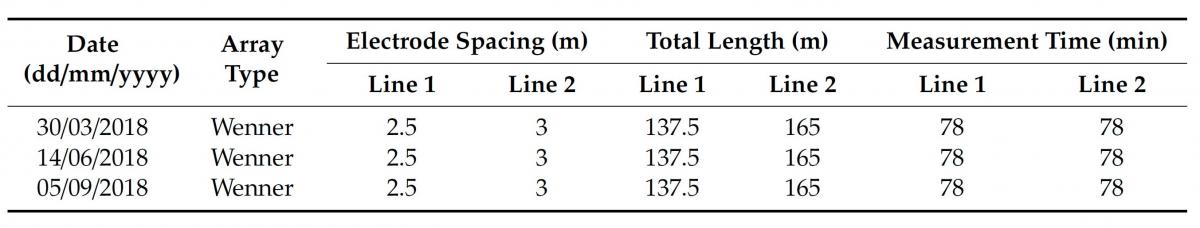
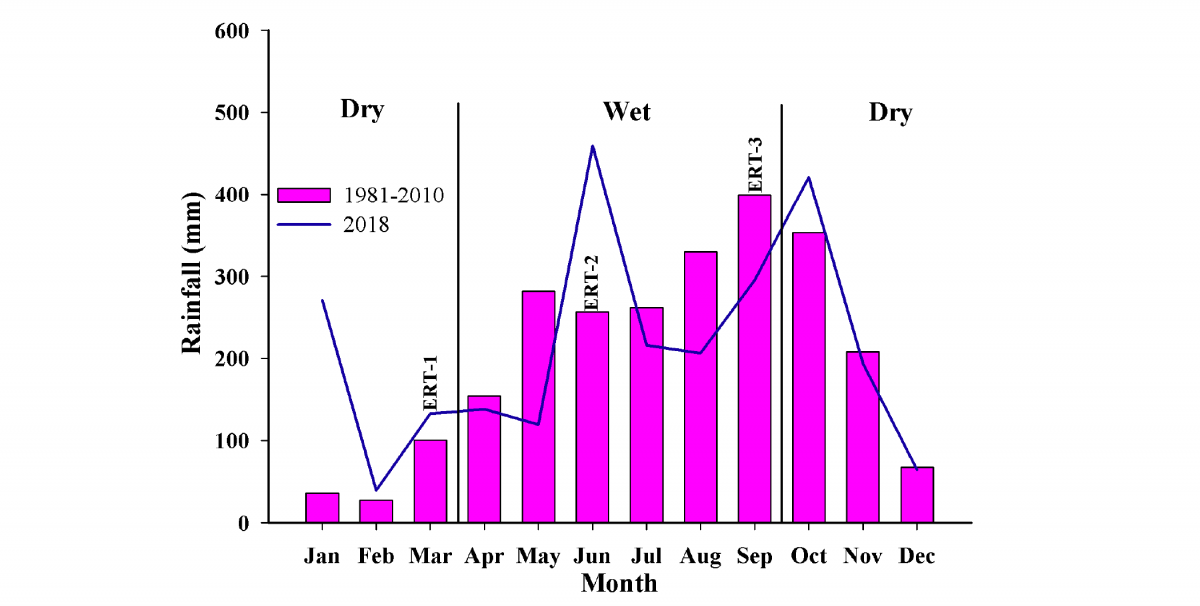
The team conducted a comprehensive survey within the Thepkasattri watershed on Phuket Island, Thailand, executing six ERI surveys across two locations. These surveys were strategically scheduled to capture the contrasting conditions of the dry and wet seasons in 2018.
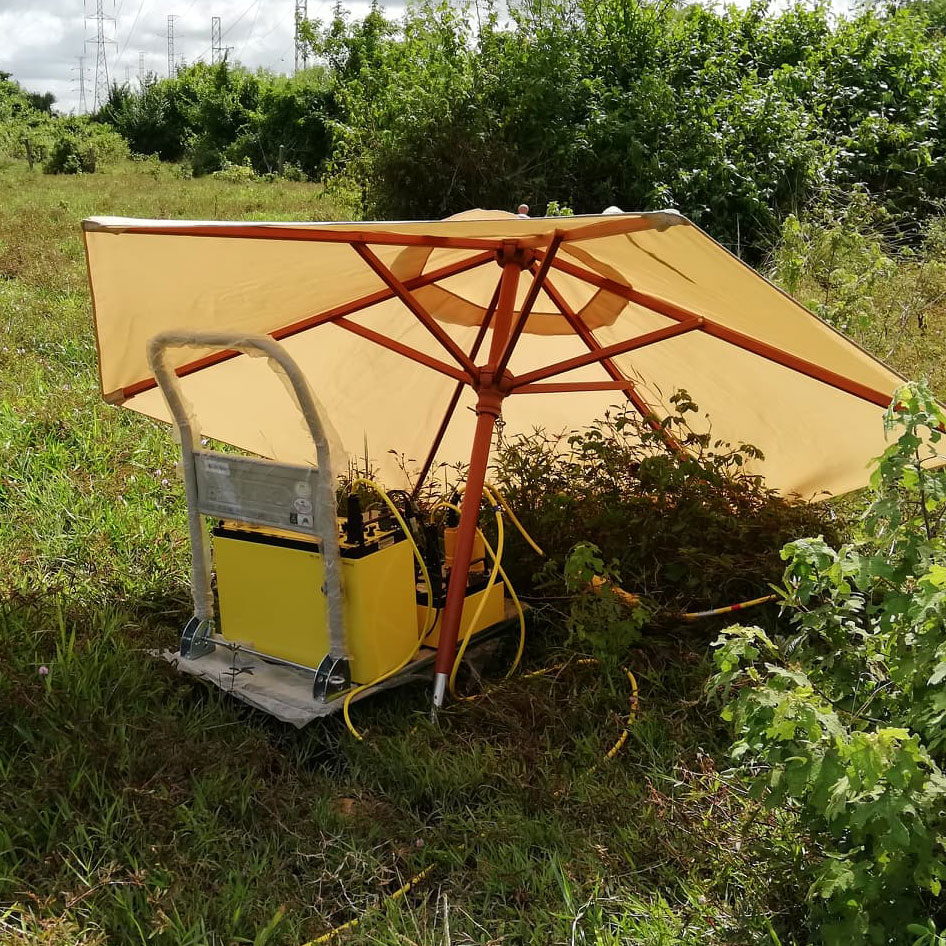
The researchers deployed a Wenner array configuration using a SuperSting™ R2 resistivity meter equipped with 56 electrodes—with line 1 at 2.5m spacing and line 2 at 3m spacing. The survey process involved meticulously arranging the electrodes along predetermined lines at both sites, ensuring consistent data collection methodologies across all seasonal surveys.
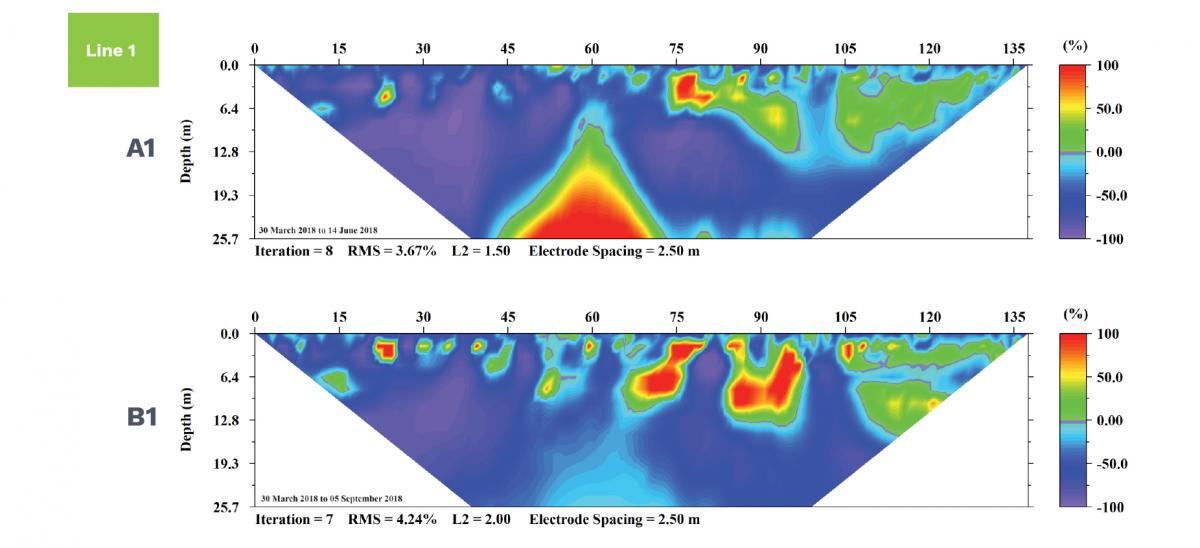
The process began by using the dry season's resistivity profile as the base model for subsequent inversions. This approach allowed researchers to identify changes in resistivity due to seasonal effects. The June and September data sets were used as the monitoring periods to assess the impact of the rainy season on groundwater recharge.
The team used EarthImager™ 2D software to invert (interpret) ERI data from field surveys as two-dimensional subsurface resistivity profiles. The smooth model inversion technique was used for time-lapse ERI analysis to compare seasonal variations.
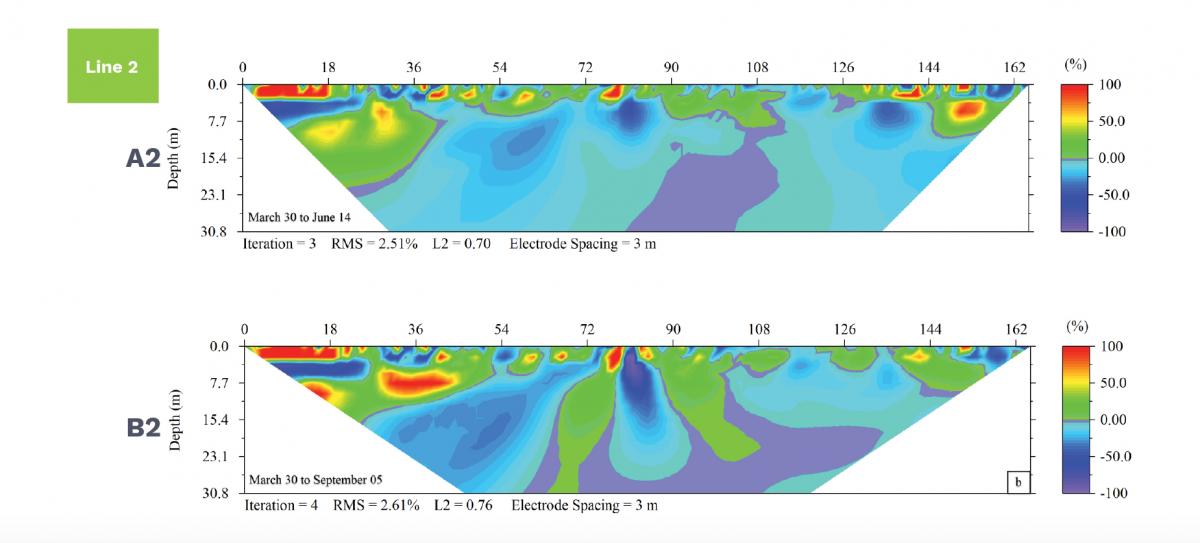
The inversion was performed for each survey, highlighting the percentage differences in resistivity between the baseline (dry season) and the monitoring datasets (wet seasons). These differences were crucial for quantifying the extent of rainwater infiltration through the vadose zone into the groundwater system. This methodological approach optimized the detection of subsurface water movements and enhanced the accuracy of interpreting the hydrogeological conditions of the study area.
For profile line 1, the results showed significant decreases in resistivity values during the rainy season, indicating substantial rainwater infiltration. This was particularly evident on the profile's right side, where the resistivity changes were most pronounced. The time-lapse data from line 1 effectively demonstrated the impact of seasonal changes on the subsurface water content, reflecting the dynamic nature of groundwater recharge processes in this part of the watershed.
Profile line 2 also exhibited similar patterns of decreased resistivity during the rainy season, corroborating the findings from profile line 1 and further supporting the evidence of adequate groundwater recharge across the study area. The results from profile line 2 reinforced the observation that rainwater infiltration is crucial in replenishing the groundwater system, especially during the monsoon periods.
Moreover, the inversion process helped develop a conceptual hydrogeological model of the area, illustrating the recharge mechanisms and the impact of seasonal changes on groundwater dynamics.
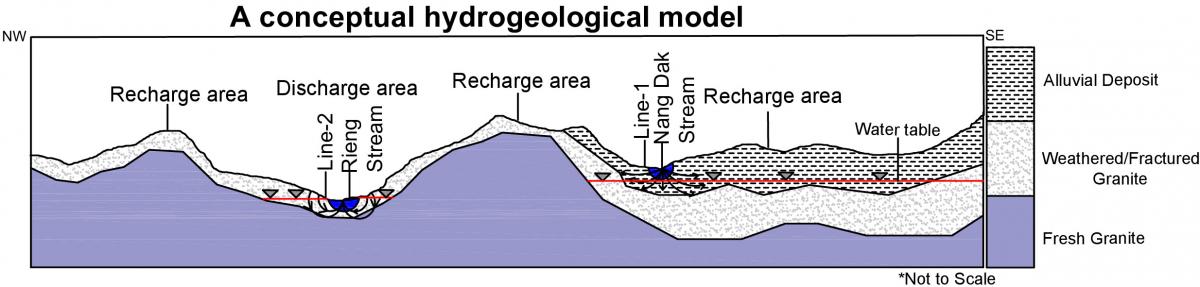
This model is a valuable tool for understanding the hydrological processes in the watershed, providing a basis for sustainable groundwater management strategies in response to seasonal variations and increasing water demand in Phuket Island.


