Skip to main content
Office Hours: M-F 8:30 AM - 5:00 PM
Home
About Us
Products
AGI Academy
Help Desk
SAGA Rentals
Blog
Contact Us
Applications / Case Histories
Application
- Any -
Aquifer
Archaeology
Borehole to Borehole Tomography
Bridge
Caves
Civil Engineering
Concrete
Construction Aggregate
Dams and Levees
Dredging
Environmental Engineering
Fluvial (rivers and streams)
Fractures
Gas Hydrates
Geology
Geophysics
Geotechnical
Geothermal
Gold Exploration
Graves/Burial Grounds/Cemetery
Groundwater
Hydrogeology
Hydrology
Karst Geology
Laboratory Setup
Lacustrine (lake)
Landslide
Marine (sea or ocean)
Massive Sulfides
Mineral Exploration
Mining Applications
Palustrine (marsh)
Pipeline
Pipes
Placer Gold
Pollution Plume
Roadway
Sandbox Test
Scale Test
Septic Tanks/Fields
Sinkhole
Soil Science
Springs (hydrology)
Strange and Unusual
Temporary Field Cables
Time-lapse
Tunnels
Utilities
Waste Management
Instrument
- Any -
MiniSting
OBEi1 Deep Marine SuperSting
SuperSting R1 Wi-Fi RES/IP/SP
SuperSting R8 w/ Marine Module
SuperSting R8 Wi-Fi RES/IP/SP
Location
- Any -
United States
Africa
Asia
Australia
Central America
Europe
Latin America
Middle East
North America
South America
Method
- Any -
Resistivity (RES)
Induced Polarization (IP)
Streaming Potential (SP)
Software
- Any -
EarthImager 1D
EarthImager 2D
EarthImager 3D
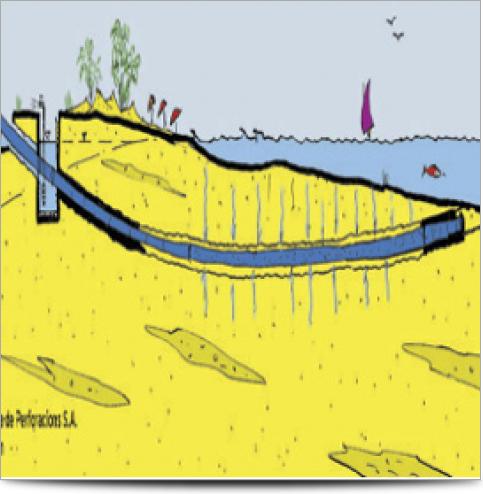
2D Combined Marine & Land Survey - Estimation of sediment depth for a dam removal project
2D Combined Marine & Land Survey
Estimation of sediment depth for a dam removal project
2D Time-Lapse Survey - Seasonal Groundwater Recharge Characterization Using Time-Lapse ERI
2D Time-Lapse Survey
Seasonal Groundwater Recharge Characterization Using Time-Lapse ERI
High-Resolution 3D Resistivity Imaging to Locate Caves - 3D Resistivity Survey
High-Resolution 3D Resistivity Imaging to Locate Caves
3D Resistivity Survey
Non-Metalic Mining Investigation - 3D ERT geophysical inspection to find economically significant granite deposits
Non-Metalic Mining Investigation
3D ERT geophysical inspection to find economically significant granite deposits
Water Dam Leakage Inspection - ERT geophysical inspection to find potential seepage areas in an earthen dam
Water Dam Leakage Inspection
ERT geophysical inspection to find potential seepage areas in an earthen dam
Biowaste Infiltration Assessment - 2D/3D Assessment of affected subsurface by biological waste pollutants from pig farms
Biowaste Infiltration Assessment
2D/3D Assessment of affected subsurface by biological waste pollutants from pig farms
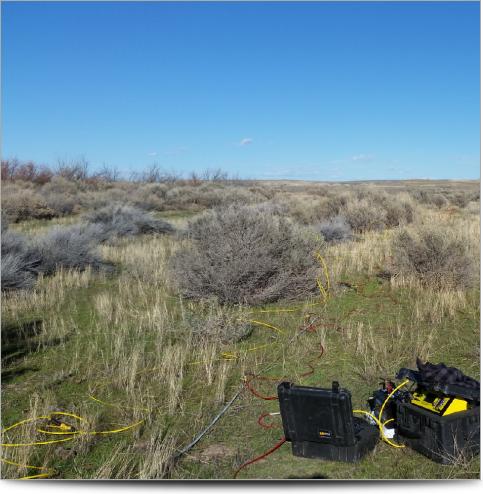
3D Time-Domain Induced Polarization of a Desert Aridisol for Septic Design - 3D IP INVESTIGATION
3D Time-Domain Induced Polarization of a Desert Aridisol for Septic Design
3D IP INVESTIGATION
Marine Resistivity Survey on the Lagoon of Venice, Italy - Marine Resistivity Investigation
Marine Resistivity Survey on the Lagoon of Venice, Italy
Marine Resistivity Investigation
Landslide Slope Investigation In The Ozark Mountains - 2D Electrical Resistivity Landslide Investigation
Landslide Slope Investigation In The Ozark Mountains
2D Electrical Resistivity Landslide Investigation
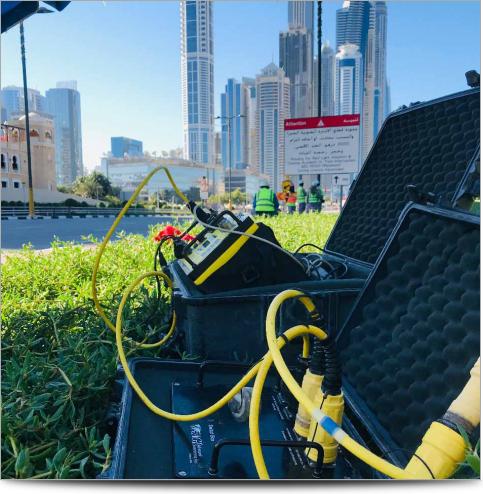
Assessing subsurface geological hazards for construction - Geotechnical Site Investigation in Dubai
Assessing subsurface geological hazards for construction
Geotechnical Site Investigation in Dubai
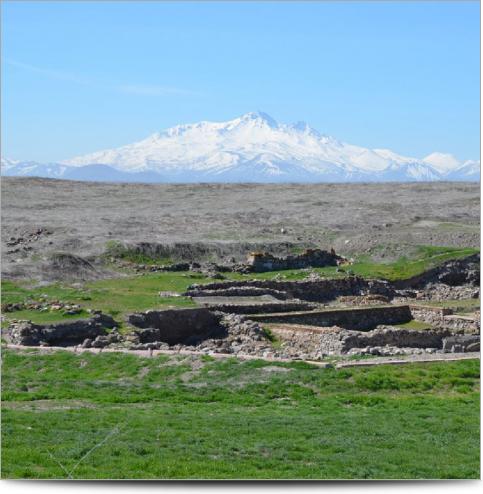
Finding Geothermal Drilling Locations and Depth in Turkey - Geothermal Site Investigation
Finding Geothermal Drilling Locations and Depth in Turkey
Geothermal Site Investigation
Mine Tailings Resistivity - 2D Resistivity Geotechnical Project
Mine Tailings Resistivity
2D Resistivity Geotechnical Project
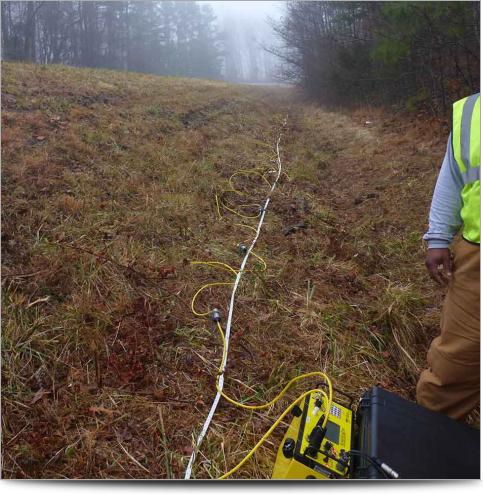
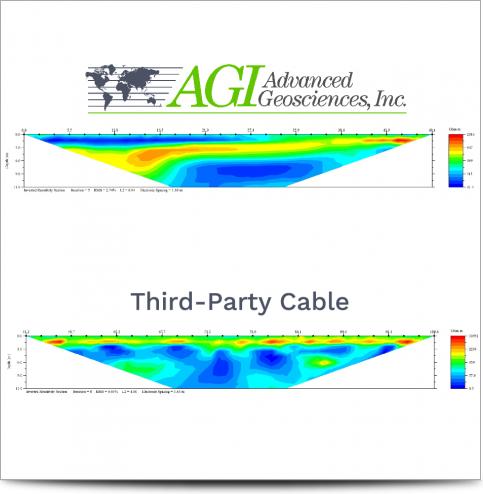
A Customer Comparison of Passive Cables - Brand-Agnostic Test 2
A Customer Comparison of Passive Cables
Brand-Agnostic Test 2
A Customer Comparison of Passive Cables - Brand-Agnostic Test
A Customer Comparison of Passive Cables
Brand-Agnostic Test
Kültepe Archeological Site Investigation in Kayseri, Turkey - True 3D Archeological Survey
Kültepe Archeological Site Investigation in Kayseri, Turkey
True 3D Archeological Survey
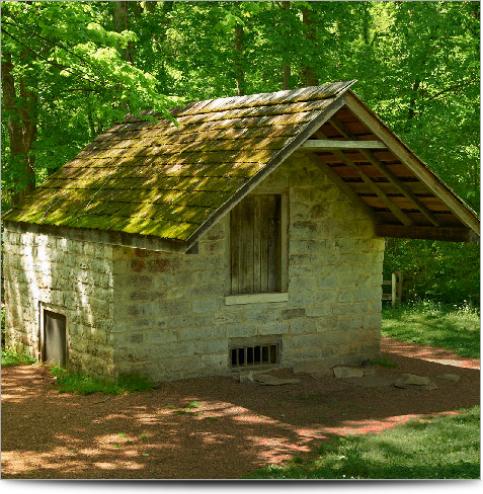
Hermitage Springhouse - 3D ERI Groundwater Mapping
Hermitage Springhouse
3D ERI Groundwater Mapping
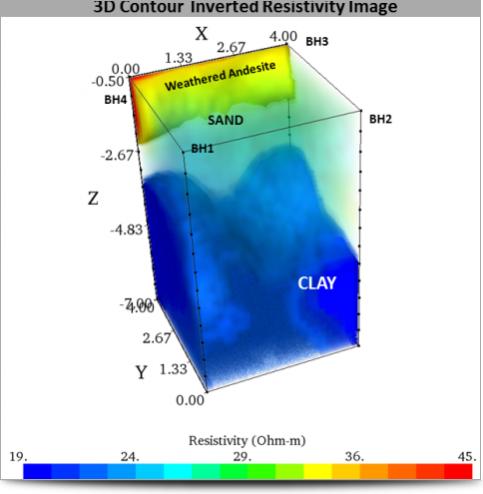
3D Cross Borehole for Geotechnical Exploration in Panama - 3D Electrical Resistivity Imaging
3D Cross Borehole for Geotechnical Exploration in Panama
3D Electrical Resistivity Imaging
Landslide During Dam Construction - 2D-3D Electrical Resistivity Imaging
Landslide During Dam Construction
2D-3D Electrical Resistivity Imaging
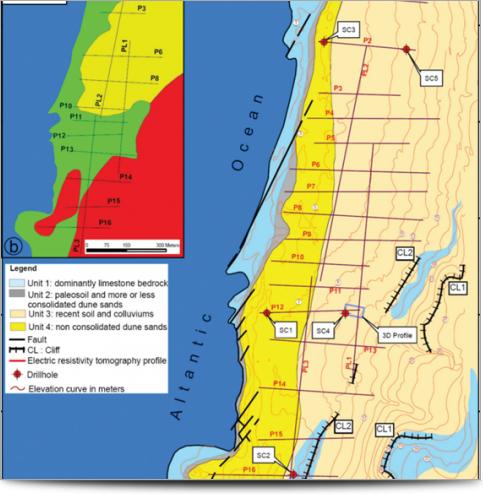
Karst and Saltwater Intrusion Mapping in Southern Morocco - 2D Electrical Resistivity Imaging
Karst and Saltwater Intrusion Mapping in Southern Morocco
2D Electrical Resistivity Imaging
Bedrock Detection Beneath River Terrace Deposits - 3D Electrical Resistivity Imaging
Bedrock Detection Beneath River Terrace Deposits
3D Electrical Resistivity Imaging
Dam Landslide Study and Cavity Detection in Colombia -
Dam Landslide Study and Cavity Detection in Colombia
3D Resistivity Imaging | New Parking Garage Structure - Locating Drainage Rates In Soils
3D Resistivity Imaging | New Parking Garage Structure
Locating Drainage Rates In Soils
2D CROSS BOREHOLE - CIVIL ENGINEERING
2D CROSS BOREHOLE
CIVIL ENGINEERING
3D Archaeological Reconnaissance with Electrical Resistivity Imaging (ERI) - Hydrocarbon Pipeline Construction
3D Archaeological Reconnaissance with Electrical Resistivity Imaging (ERI)
Hydrocarbon Pipeline Construction
3D Mapping of Cross-Cutting Diorite Dikes -
3D Mapping of Cross-Cutting Diorite Dikes
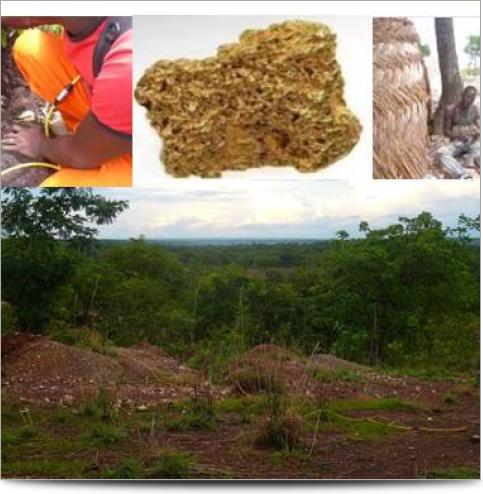
2D and 3D Gold Exploration in Burkina Faso -
2D and 3D Gold Exploration in Burkina Faso
2D Resistivity Imaging for Locating Concrete Pipe -
2D Resistivity Imaging for Locating Concrete Pipe
Vertical Electrical Sounding for Geotechnical Site Characterization -
Vertical Electrical Sounding for Geotechnical Site Characterization
Geotechnical Site Characterization on a Cliff for a Dam Construction - High Contact Resistance Survey
Geotechnical Site Characterization on a Cliff for a Dam Construction
High Contact Resistance Survey
3D Offshore Imaging For Seawater Intake For Desalination Plants -
3D Offshore Imaging For Seawater Intake For Desalination Plants
Monitoring Streaming Potential At An Open-Pit Aggregate Mine -
Monitoring Streaming Potential At An Open-Pit Aggregate Mine
Using Resistivity For Basalt Site Characterization -
Using Resistivity For Basalt Site Characterization
Vertical Electrical Sounding (VES) - 1km Deep Geothermal Application
Vertical Electrical Sounding (VES)
1km Deep Geothermal Application
Mapping Land Beneath A Planned Pipeline Near Carlsbad Caverns -
Mapping Land Beneath A Planned Pipeline Near Carlsbad Caverns
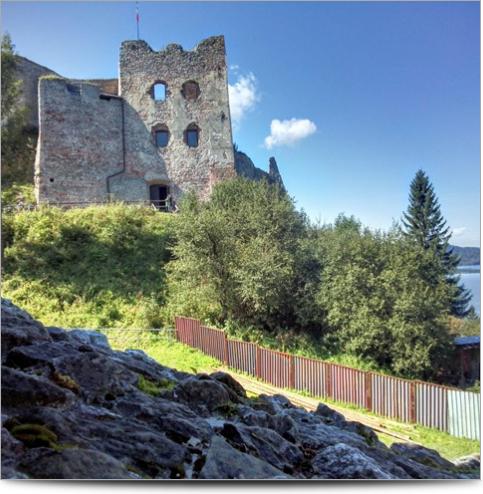
Identifying Archeological Remnants At Czorsztyn Castle -
Identifying Archeological Remnants At Czorsztyn Castle
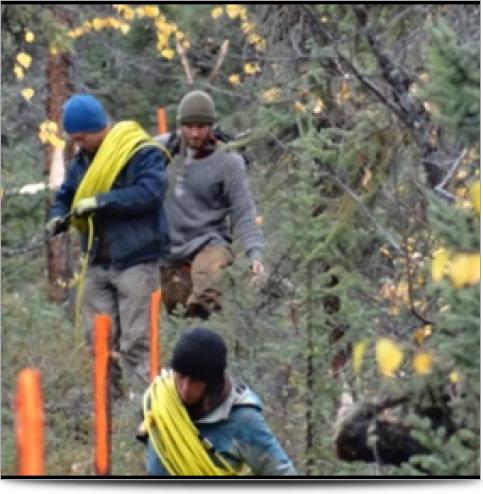
Locating Gold Deposits In The Yukon - There’s gold in the hills. We proved it.
Locating Gold Deposits In The Yukon
There’s gold in the hills. We proved it.
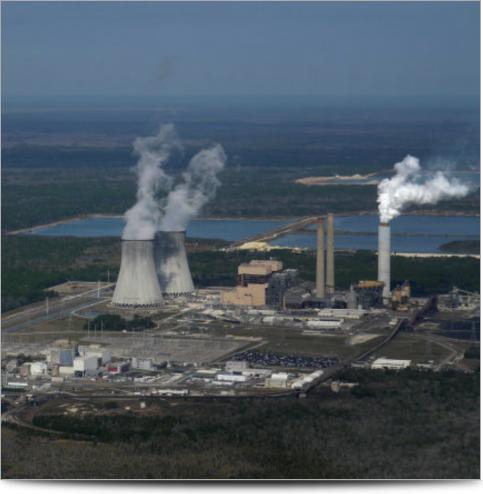
Identifying Karst Formations Under A Nuclear Cooling Pond -
Identifying Karst Formations Under A Nuclear Cooling Pond
3D Heap Leach Monitoring - 3D Irrigation Monitoring at a Heap Leach Copper Mine
3D Heap Leach Monitoring
3D Irrigation Monitoring at a Heap Leach Copper Mine
Heap Leach Pad Monitoring - Irrigation Monitoring at a Heap Leach Copper Mine
Heap Leach Pad Monitoring
Irrigation Monitoring at a Heap Leach Copper Mine
Searching For Archeological Anomalies In The Oluz Mound -
Searching For Archeological Anomalies In The Oluz Mound
Landslide Investigation In Turkey -
Landslide Investigation In Turkey
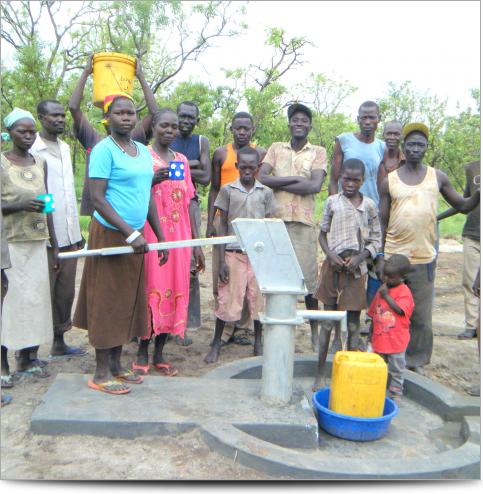
Groundwater Exploration In South Sudan -
Groundwater Exploration In South Sudan
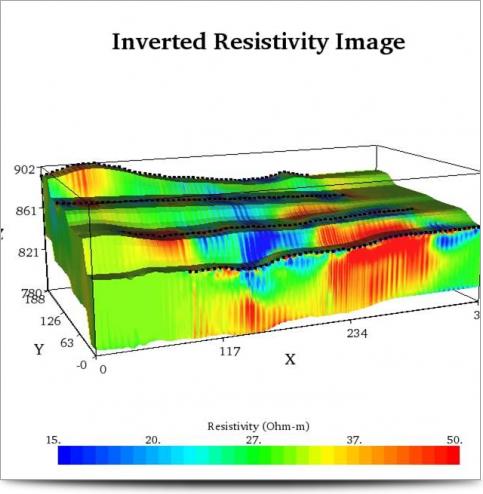
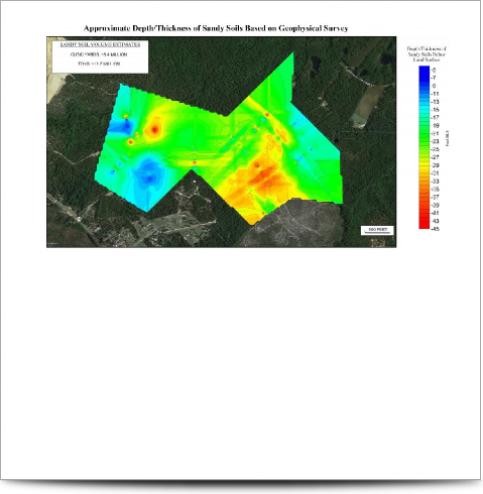
Mapping Sand Unit Thickness For Construction Aggregate In North Carolina -
Mapping Sand Unit Thickness For Construction Aggregate In North Carolina
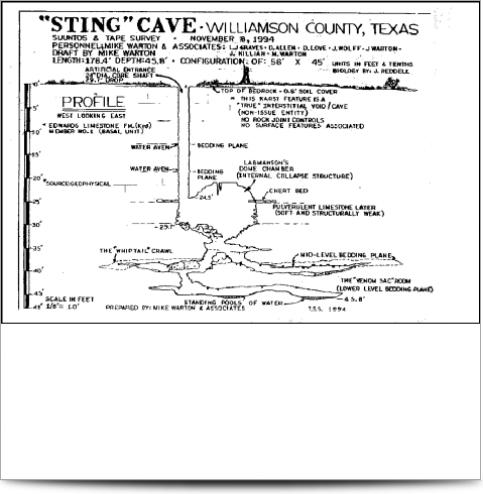
Cave Detection: Testing The Industry’s First Electrical Resistivity Imaging Instrument -
Cave Detection: Testing The Industry’s First Electrical Resistivity Imaging Instrument
Exploring Soil Resistivity In Lima, Peru -
Exploring Soil Resistivity In Lima, Peru
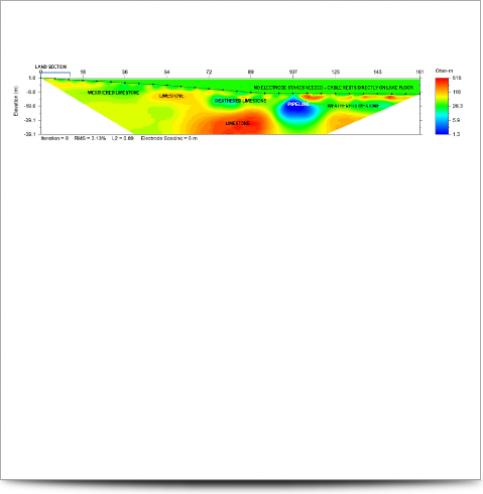
Mapping Bedrock Surfaces Near Lake Travis, Texas -
Mapping Bedrock Surfaces Near Lake Travis, Texas
Surveying For 600-Meter-Deep Groundwater In Kenya -
Surveying For 600-Meter-Deep Groundwater In Kenya
Scanning For Leaks & Sinkhole Detection In A Retention Pond -
Scanning For Leaks & Sinkhole Detection In A Retention Pond
Searching For Potential Unmarked Graves Near San Antonio, Texas -
Searching For Potential Unmarked Graves Near San Antonio, Texas
Locating Groundwater Wells For Fracking Operations In West Texas -
Locating Groundwater Wells For Fracking Operations In West Texas
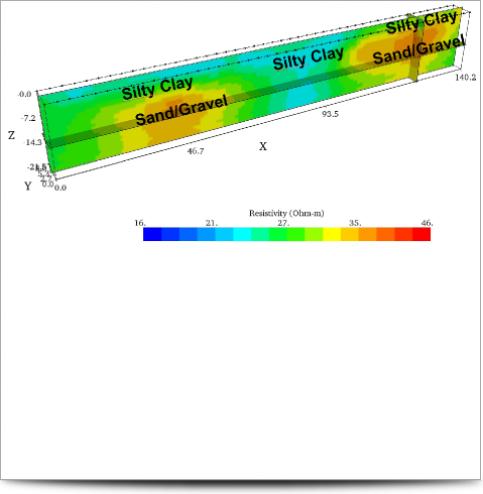
Construction Aggregate Mining: Sand & Gravel - Estimating Sand & Gravel Volumes For Construction Mining
Construction Aggregate Mining: Sand & Gravel
Estimating Sand & Gravel Volumes For Construction Mining
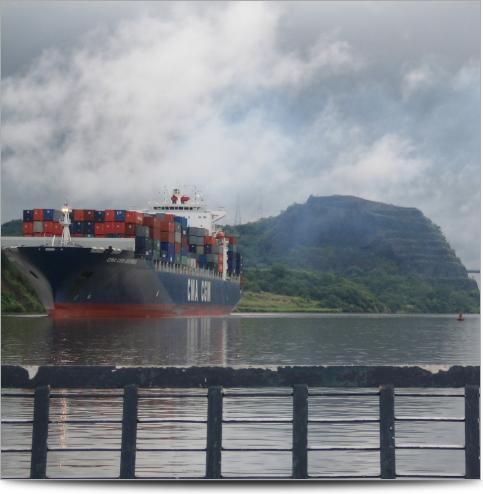
Panama Canal Boat-Towed 3D Resistivity Surveys - Reducing Expansion Costs Of The Panama Canal
Panama Canal Boat-Towed 3D Resistivity Surveys
Reducing Expansion Costs Of The Panama Canal
Springs Limestone Fractures - Exploring & Imaging Limestone Fractures At Comal Springs
Springs Limestone Fractures
Exploring & Imaging Limestone Fractures At Comal Springs
Mineral Exploration In Colombia - Investigating Mineral Exploration For Volcanic Ash In Colombia
Mineral Exploration In Colombia
Investigating Mineral Exploration For Volcanic Ash In Colombia
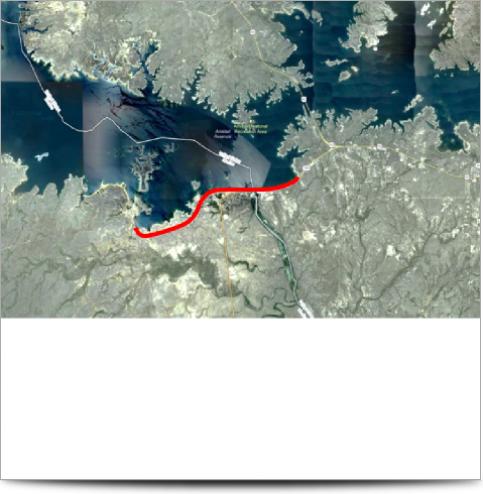
Amistad Dam - Identifying Critical Leaks In The Amistad Dam
Amistad Dam
Identifying Critical Leaks In The Amistad Dam