The USGS has done stellar work to better understand the erosion of shorelines on the U.S. Arctic coast. Two teams of scientists traveled to the very actively eroding Barter Island to collect data. Both teams observed erosion and associated shoreline loss through various means, which you can read about in full here.
This being the AGI blog though, we want to focus on the Electrical Resistivity Tomography (ERT) part of the project.
In September 2018, Ferdinand Oberle worked as an Oceanographer for the project. He spearheaded the ERT data collection and mapped the permafrost of the coastal bluffs.
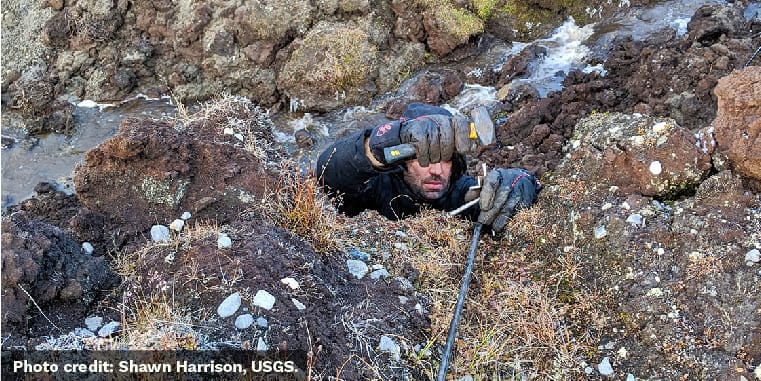
Pictured Above: Ferdinand Oberle hammering stainless steel stakes for his ERT survey
Oberle opted for ERT to take advantage of ice’s high electrical resistivity. The ice's high resistivity in relation to surrounding soils makes for good contrast in the data. This high contrast clearly indicated where large pockets of ice-rich soils were.
These ice pockets need to be monitored for their erosion potential. Dangerous levels of erosion—and sinkholes—could take place if those pockets of ice were to melt.
Oberle’s survey had an impressive scope too—spanning the entire length of the island’s bluffs—about 2km. AGI’s very own Jason Greenwood helped Oberle with data processing and inversion. You can see the continuous profile below. The red areas in the inversion profile clearly illustrate where permafrost is located.
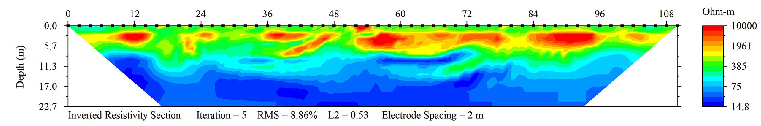
Pictured Above: Oberle's ERT data. Image courtesy of Ferdinand Oberle, USGS.
