On our blog, we’ve covered 1D, 2D, and 3D Electrical Resistivity Imaging (ERI) surveys numerous times. We’ve made general comparisons and even compared how useful each is for groundwater exploration. One type of survey we don’t talk about is 4D ERI. Let’s talk about that today. So, what is a 4D ERI survey?
CONTACT US TO LEARN MORE
It's about time (literally)
We all know and love Electrical Resistivity surveys. It’s the method used to measure the electrical resistivity of subsurface materials. It involves sending electrical currents into the ground and measuring the resulting voltages to infer the resistivity of the subsurface materials. But of course, we don’t need to tell you that.
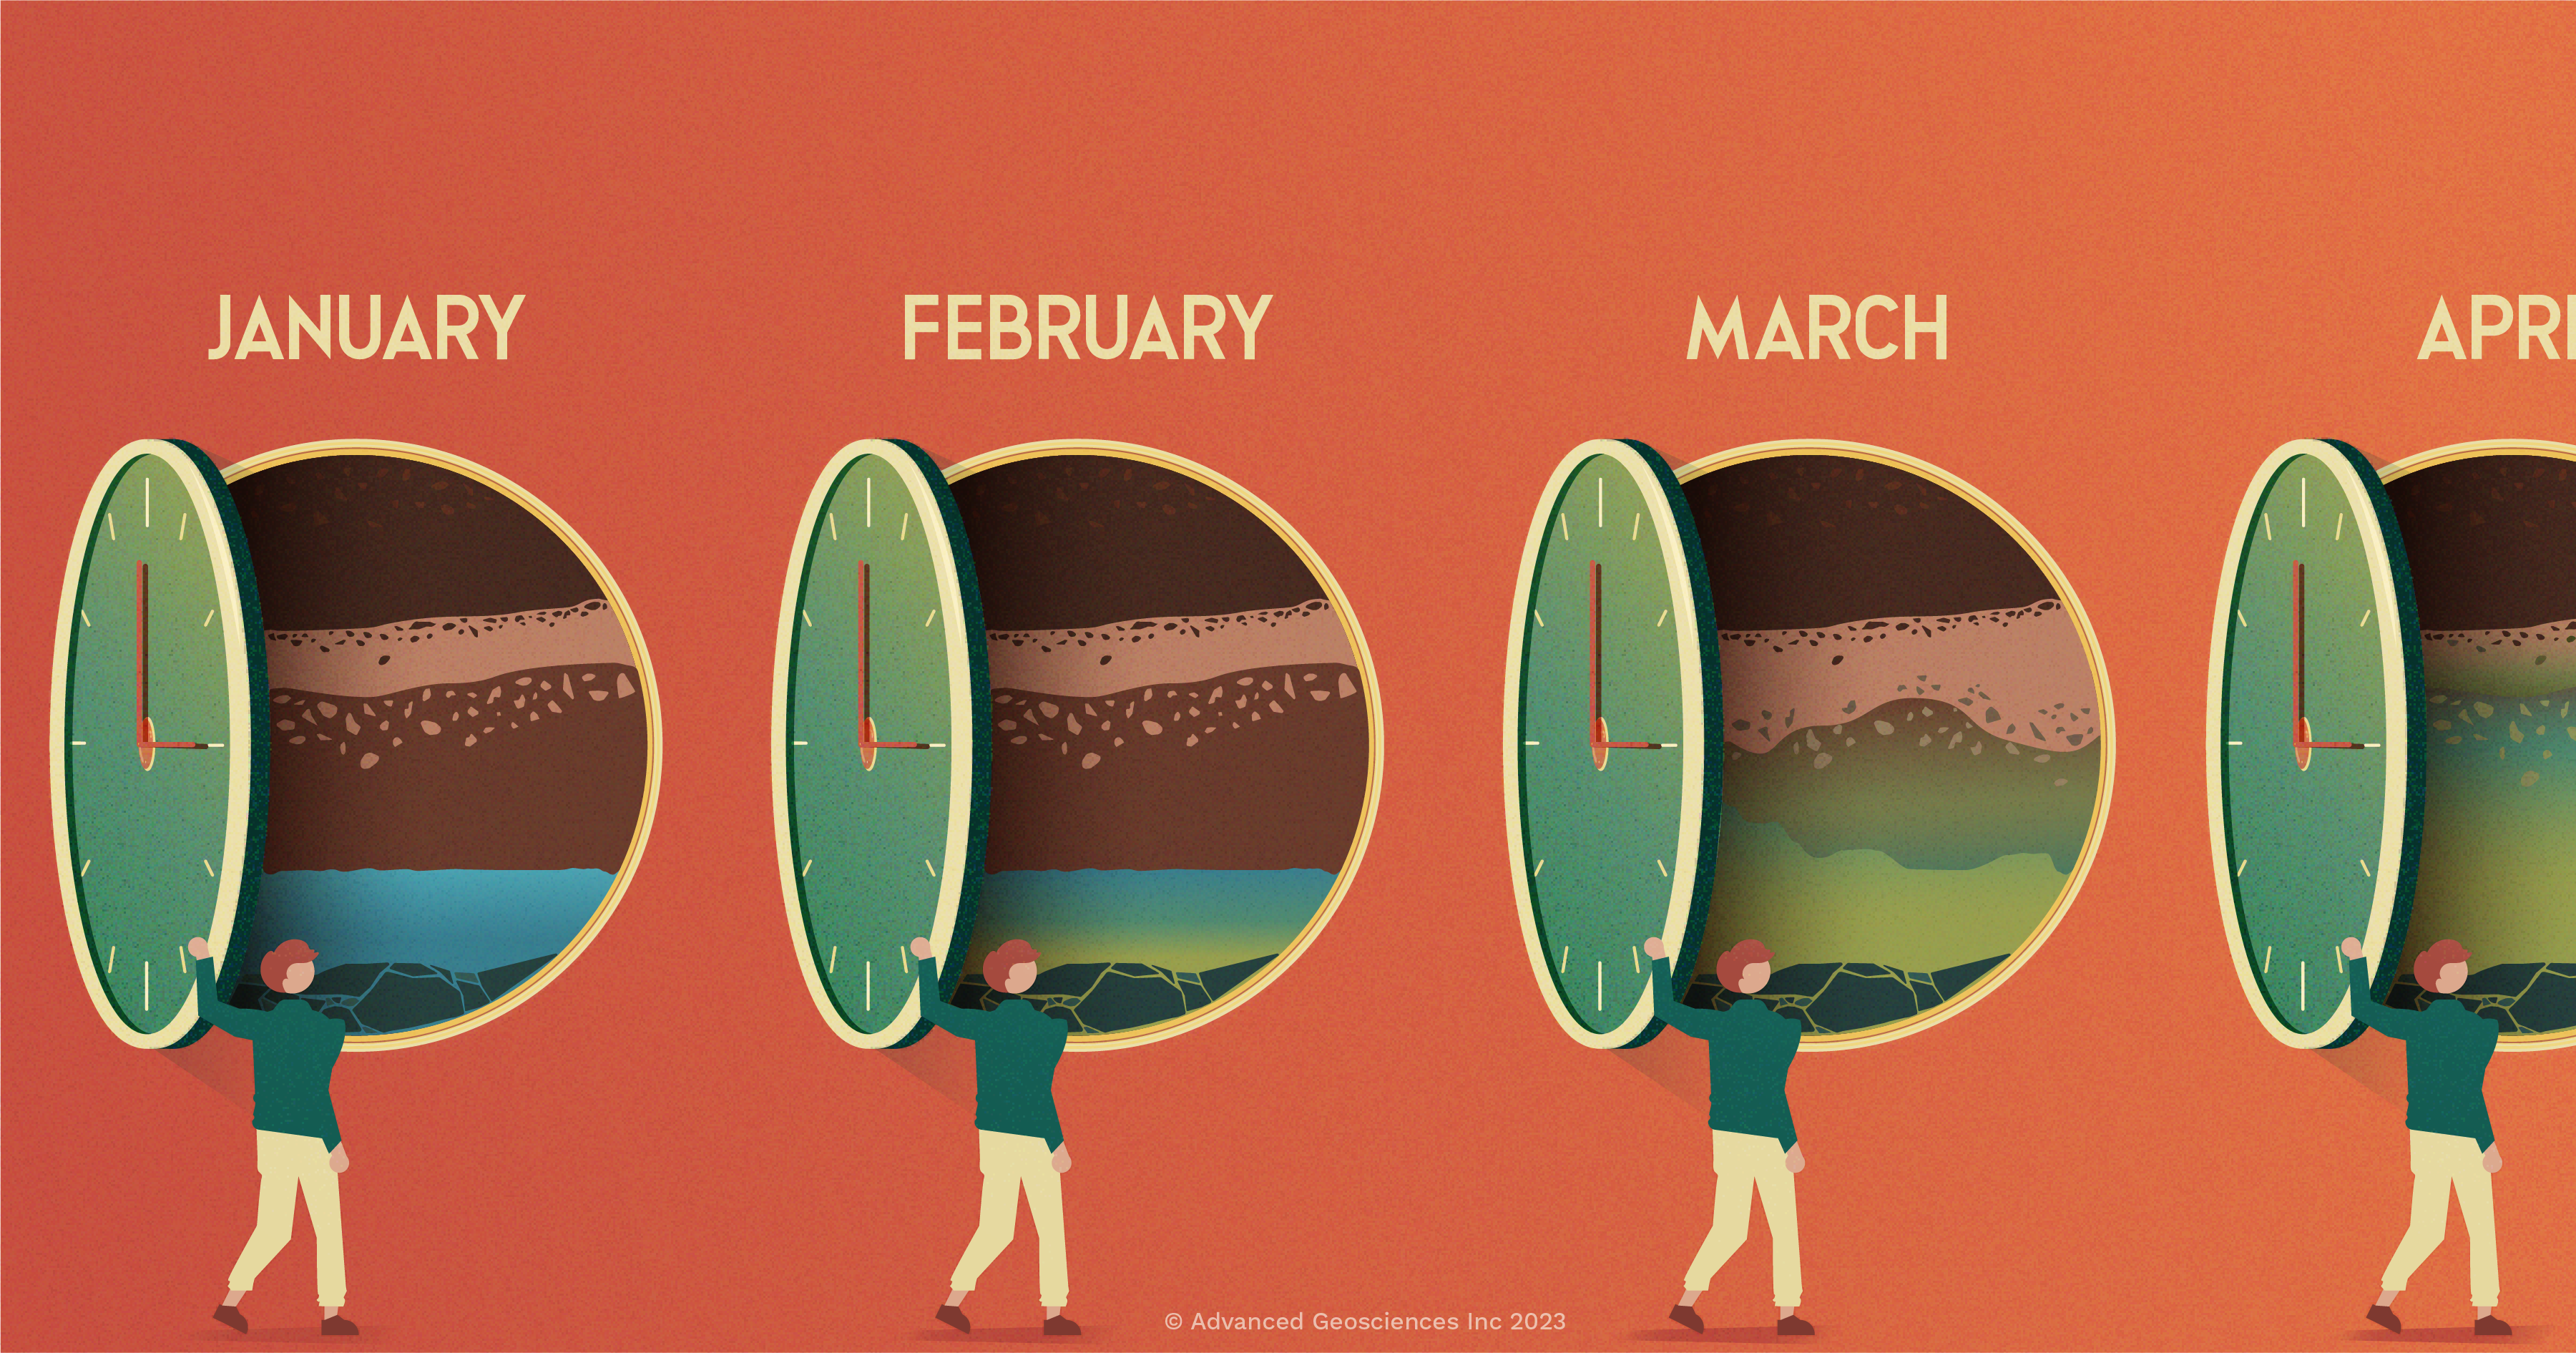
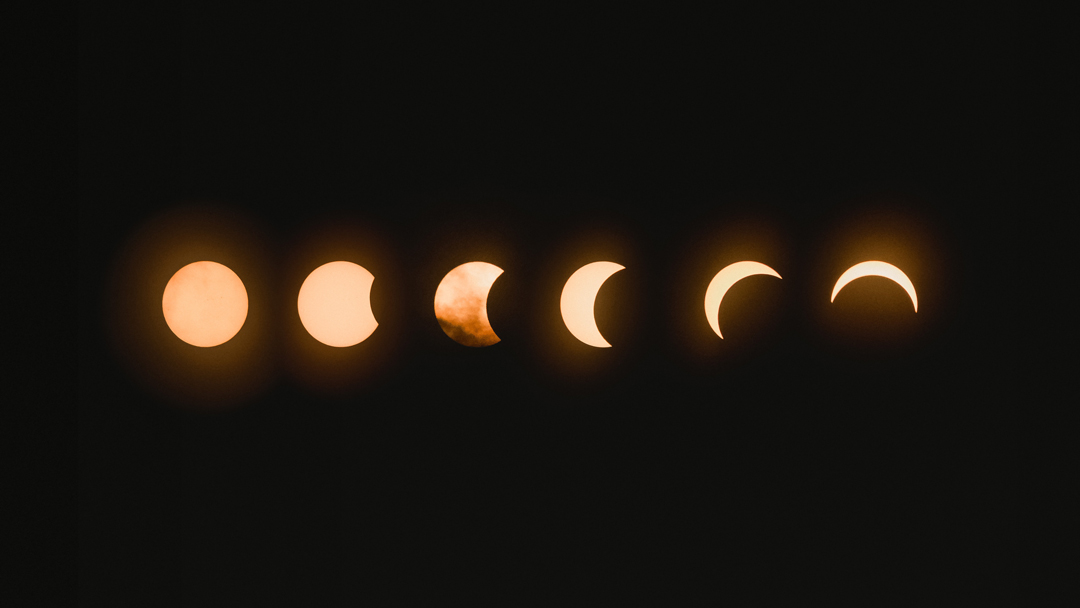
The “4D” aspect of the survey refers to the fact that it is done over time; that is, it is repeated at intervals to monitor changes in the subsurface resistivity. This approach is most commonly called time-lapse resistivity imaging. You’re basically performing the same survey in the exact location several times. The only difference is the time when the data is collected. After two or more data sets are collected, you can compare them over time to track changes.
Time-Lapse (4D) Surveys can span days, weeks, months, and even years.
What’s interesting about a “4D survey” is it’s not technically an ERI survey as we traditionally categorize them. You can apply it to all other ERI surveys—even 1D. There’s no special equipment needed beyond what’s already used for RES/IP/SP. There are some considerations to make (more on that below), but the only real addition to your tool set is time.
What are some use cases for time-lapse ERI surveys?
A 4D electrical resistivity survey is a handy tool for assessing subsurface conditions and identifying changes over time. This can be useful for various applications such as monitoring potential environmental or geologic hazards, following subsurface fluid movement, tracking changes in soil moisture, and more.
It is mostly done by institutions working in Oil/Gas, Mining, Agricultural, Geotechnical, Environmental, and groundwater industries to evaluate the subsurface conditions, monitor the changes, and optimize their operations.
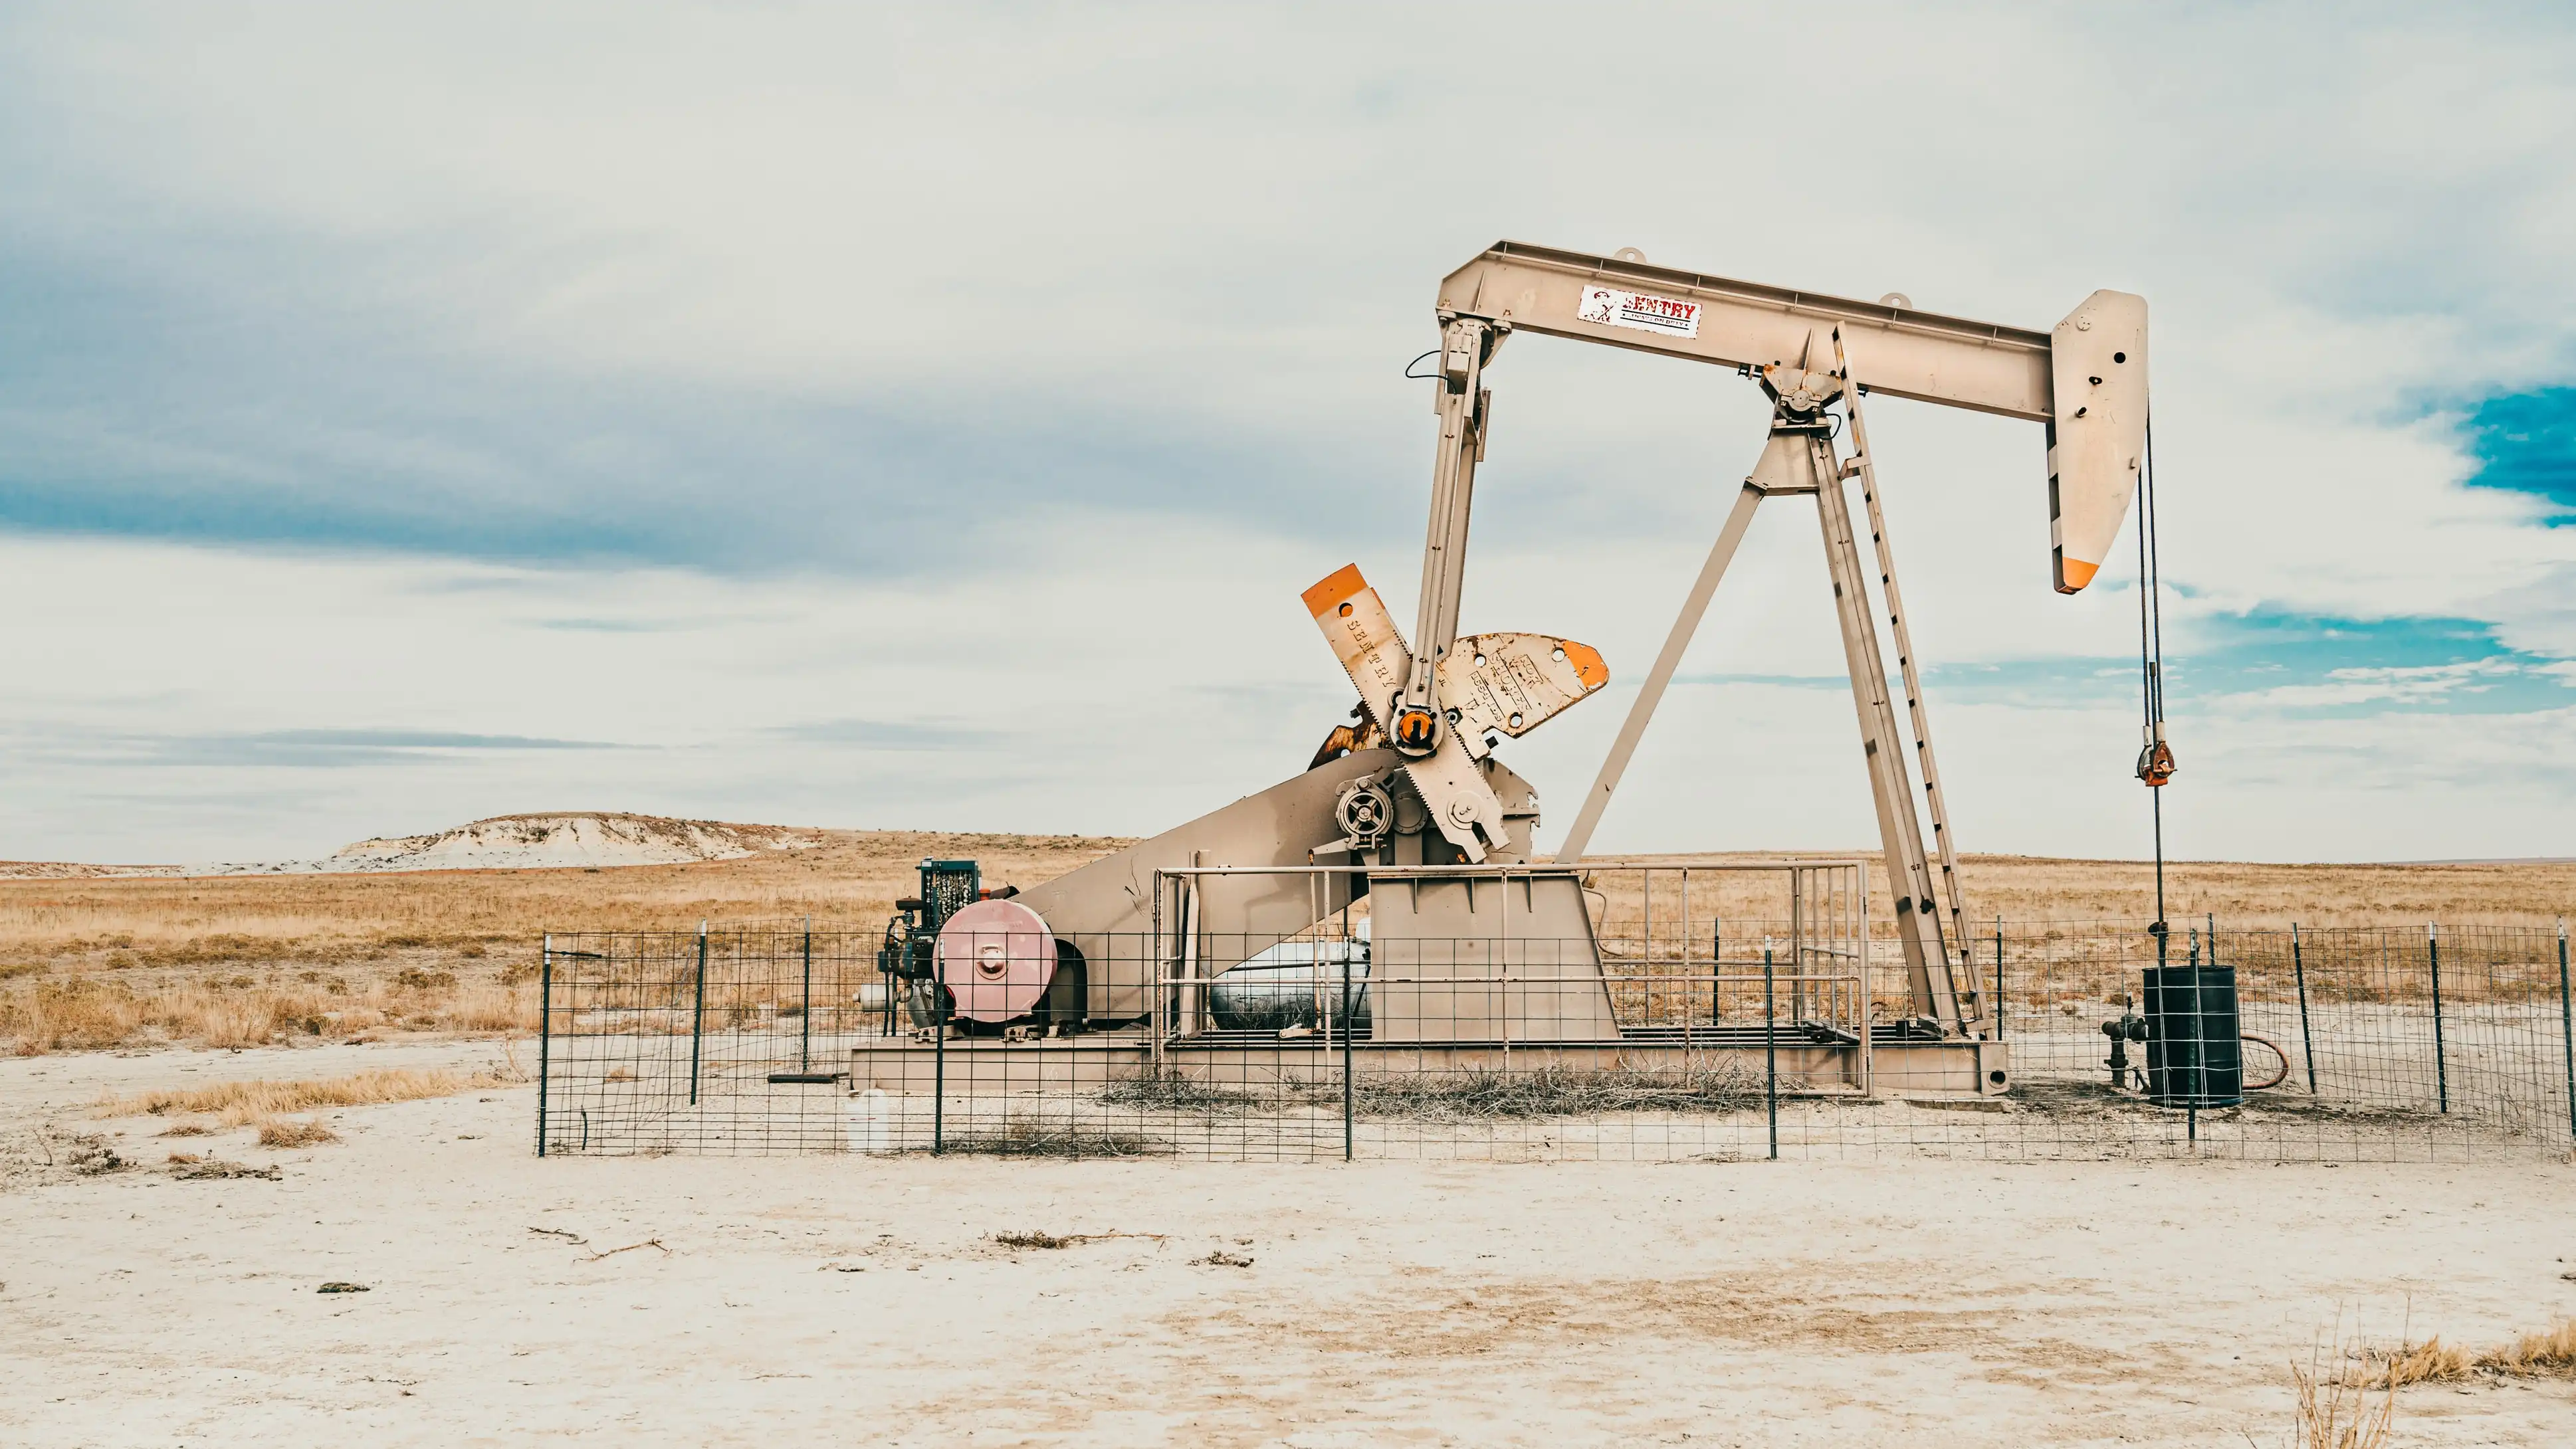
For example, an Oil/Gas company may deploy a 4D survey to monitor fluid movement in an oil reservoir. The survey typically involves repeated resistivity measurements at regular intervals throughout the reservoir’s life (e.g., monthly or quarterly). By comparing the resistivity images over time, changes in the fluid saturation can be detected and used to optimize production and improve recovery. It’s also used to evaluate the productivity of oil and gas reservoirs and monitor the progress of enhanced oil recovery (EOR) operations.
Another example is from the environmental industry, where time-lapse resistivity is used to monitor the movement of contaminants in groundwater and assess the effectiveness of remediation methods. By repeating the measurements over time, the changes in the distribution of the contaminants can be detected and used to optimize the remediation efforts.
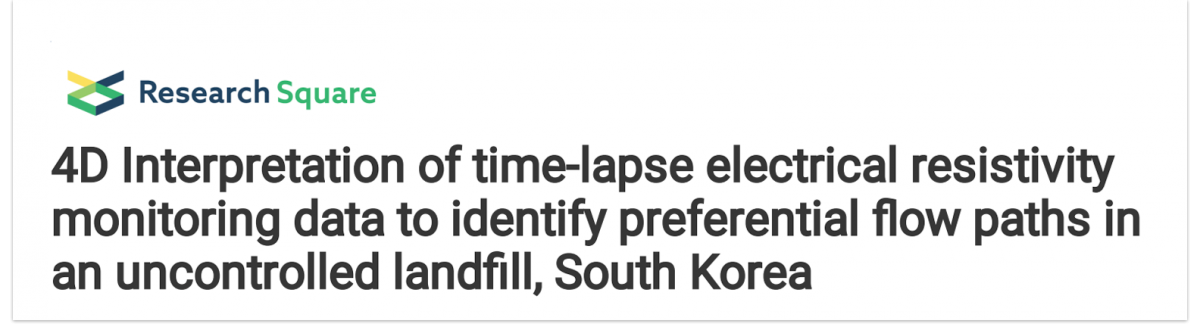
One such survey was conducted in Korea, which you can check out the preprint here:
Some considerations
As with any technique, 4D Electrical Resistivity surveys have certain limitations and drawbacks. Some main drawbacks include the following:
Time & Cost:
Time is money. So naturally, 4D resistivity surveys are more expensive than traditional surveys due to the additional costs of repeated measurements and data analysis. The duration of a 4D Electrical Resistivity survey will depend on several factors, including the size of the survey area, the number of electrodes used, the frequency of the measurements, and the specific method used.
The survey may be completed in a day or two for a small survey area with a limited number of electrodes. The survey may take a week or more to complete for a more extensive survey area with more electrodes or a higher measurement frequency.
The first step is usually the data acquisition, which may take several hours or days—depending on the number of electrodes and measurement points. After the data is acquired, it will be processed and interpreted to create images of the subsurface resistivity. This step may take anywhere from a few days to several weeks, depending on the data’s complexity and the desired detail level in the images.
Once the survey is completed, the results must be analyzed and interpreted. This process may take additional time, depending on the complexity of the data, your specific objectives, and your knowledge of inverted resistivity data.
Complexity:
Interpreting 4D resistivity data can be challenging, as it requires advanced data processing and interpretation techniques. The complexity of the data also increases with the number of measurements, making it difficult to identify subtle changes in the subsurface resistivity.
Environmental considerations:
4D resistivity surveys can be affected by environmental factors such as temperature, humidity, and precipitation. These factors can change the resistivity of the subsurface, making it difficult to interpret the data and identify changes over time.
Spatial resolution in relation to depth:
We’ve discussed in a previous blog how electrode spacing is directly related to the depth of your survey. If the spacing between electrodes is large, it could limit the resolution of the survey and make it difficult to identify small changes in resistivity.
Despite these drawbacks, 4D resistivity surveys are still valuable for monitoring subsurface conditions and detecting changes over time. By understanding the method’s limitations and carefully designing the survey, it is possible to obtain valuable and accurate data to make crucial decisions in various fields.
If you’re considering a time-lapse ERI survey for your next project, contact us for assistance with equipment selection, array advice, and other considerations.
TL;DR
A 4D ERI survey is commonly called a time-lapse Electrical Resistivity survey. It simply implies that you are taking the exact measurements over a period—usually over several days or weeks. It tracks movement in the subsurface from things like plumes and groundwater. It’s advantageous but takes more time than typical surveys due to repeated measurements and data inversion.
