- Office Hours: M-F 8:30 AM - 5:00 PM
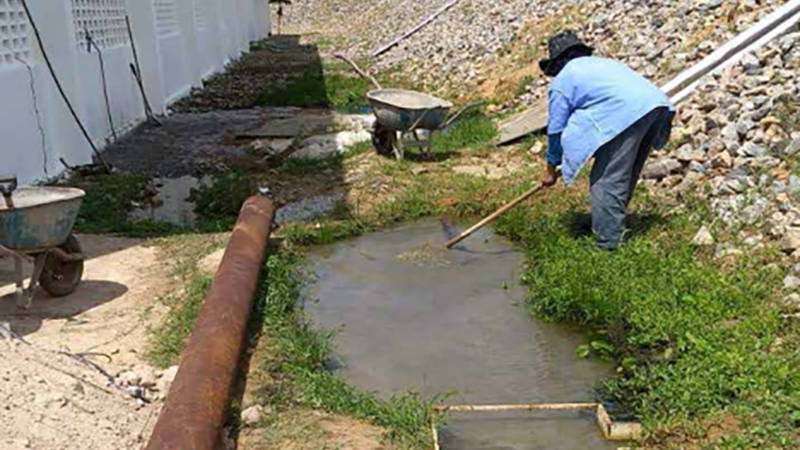
When visible pools of water were seen on the surface near the dam, it was obvious that a leak had occured. The leak produced water at roughly 10L/s. It was unknown if this seepage was coming from the dam’s levee structure or in the subsurface below. Our client, Global Image, concluded that an Electrical Resistivity Imaging (ERI) profile was needed to map areas as potential sources of this leakage. They used AGI's equipment to complete this task.
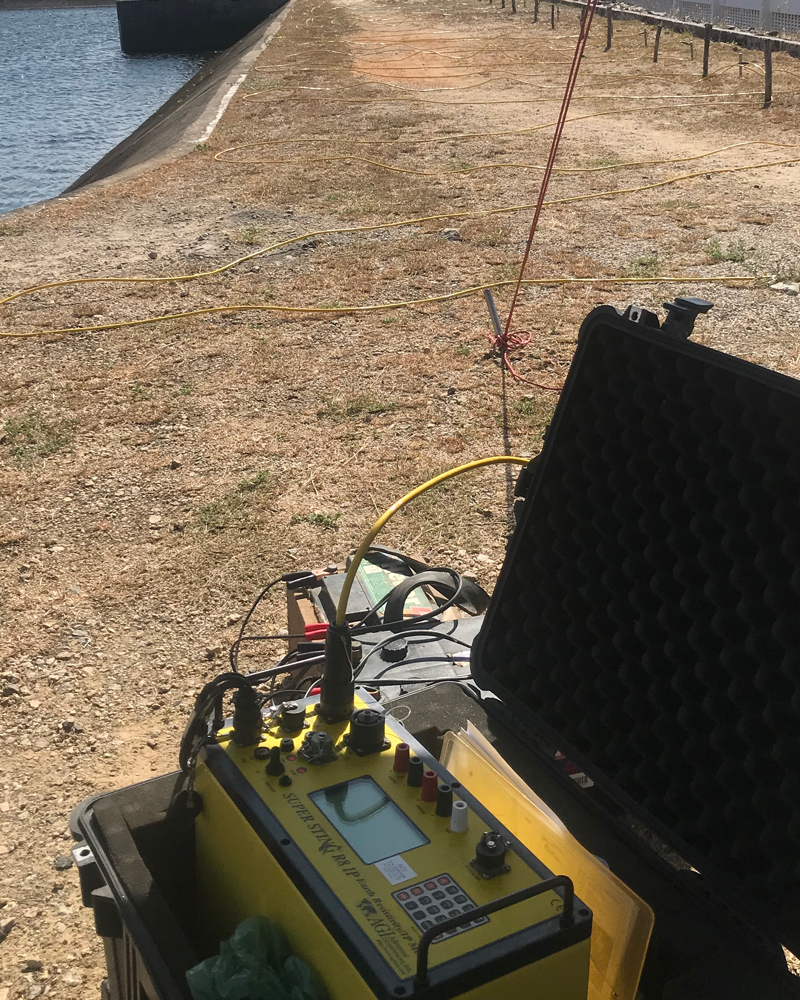
Global Image decided to focus on the crest of the dam that was closest to where the leak was seen on the surface. They installed a 2D resistivity line over the entire length of that section of the crest. The 2D data was collected using a SuperSting™ R8/IP and a 56-electrode SwitchBox implementing a Dipole-Dipole array. Though they used a SwitchBox 56, only 37 active electrodes were used with 2m electrode spacing. The obtained 2D data was then processed and inverted with EarthImager™ 2D.
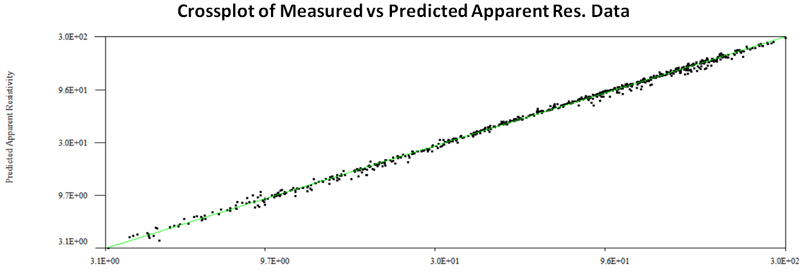
The crossplot above shows that the data was obtained cleanly with very little noise. When observing crossplots, you want to see the majority of your data points along the diagonal line. This gives us confidence in the inversion model and results.
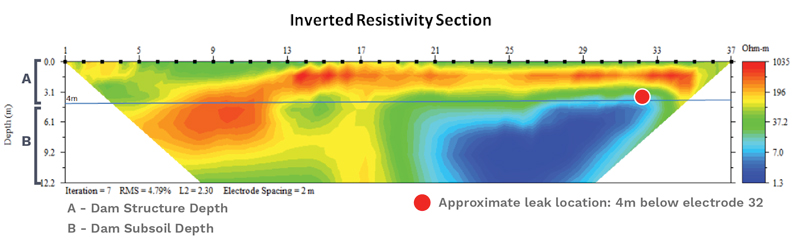
Preliminarily, it was believed that the leak originated somewhere in the dam structure (A) since the leak was visible on the surface. After an analysis of the 2D resisitivity model, integrated with topographic data, the dam’s primary conductive anomaly was found in the subsoil beneath the dam structure (B). The conductive anomaly is depicted via the blue areas between electrodes 20 through 33 in the inversion model above.
A 5-pipe sluice structure was located on the same crest near the leak. These 900mm pipes had a depth of 7m and were associated with the conductive anomaly in the subsurface—which was near the eastern sector of the structure. All data indicated to Global Image that the water accumulated in the subsoil and made its way to the surface. As the primary and starting point of the leak is close to electrode 32, the sector east of the pipeline structure could be committed.
Data and Survey Details Courtesy of: Global Image | globalimage.com.br


