In a previous post, we briefly spoke about the difference between 1D, 2D, and 3D Electrical Resistivity Imaging (ERI) surveys. In our recent blog post about the amount of channels you need for your Resistivity system, we touched upon the two types of 3D ERI surveys one can do—that is, true cross line measured 3D and linear-measured 3D. Let’s dive deeper into this topic and see what the difference is between the two types—and which is better suited for your needs.
True 3D
When you see us talk about 3D on social media and on the blog, we usually show examples of true 3D surveys. As the name suggests, data is collected on the x, y, and z axis. With the inclusion of the z-axis data, inversion of 3D data sets can produce a volume image showing 3D subsurface resistivity distribution.
For data collection, the electrodes are placed in a snake-like grid on the survey area (seen below).
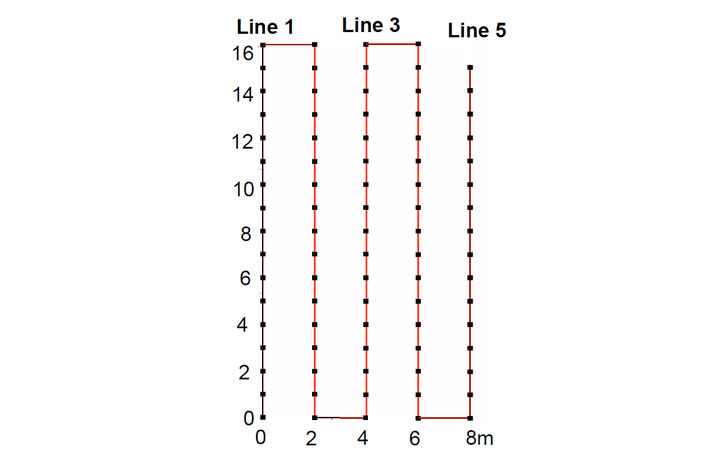
Above: An example of the electrode layout for true 3D. In this example, 84 electrodes are laid out in a 5 x 17 grid with one electrode short at the end of an electrode cable (Line 5). The inline electrode spacing is 1 meter and the line spacing is 2 meters. The distance unit is meters.
Linear-Measured 3D
This type of survey has a few monikers, such as 2.5D or pseudo 3D. For our purposes, we’ll stick with linear-measured 3D. Linear-measured 3D is a 3D survey in which you combine multiple parallel 2D lines into a 3D data set.
Mathematically, 2D line data is collected only on the X axis (XZ medium) or Y axis (YZ medium)—or two dimensions—even though the subsurface is inherently three-dimensional. Because of this, in a 2D inversion program—2D cross sections always have the built-in assumption that the earth has a two-dimensional resistivity distribution. In other words, the data you see in your 2D inversion goes on forever, unchanged, in the Y axis. Of course, we know this isn’t the actual case. Only as a result of multiple linear 2D lines can you create an approximation of a Y axis.
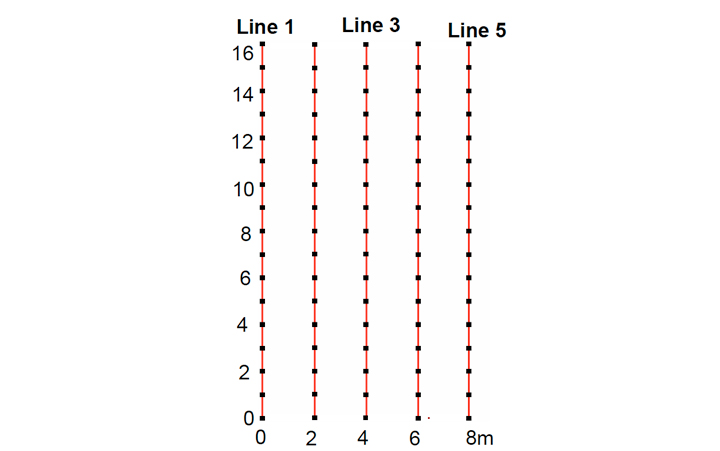
For data collection, electrodes are placed in a straight line on the ground’s surface for a 2D survey (seen below) or in two vertical boreholes to build a 2D cross borehole segment. Once each data set is complete, the line or lines are moved in a parallel manner to the next spacing and the measuring process is repeated. The line spacing should be equal to or a maximum of twice the electrode spacing. This process is continued until the desired 3D survey area has been covered.
How do they compare?
For our comparison, we’ll break down the process into two major parts—data collection and data interpretation. In data collection, we’ll compare how the two types of 3D compare in regards to survey setup, speed of collection, and depth achieved. For data inversion, we’ll compare resolution and volume interpretation of the inverted results.
For this comparison, the data was obtained using a SuperSting™ R8 with 84 electrodes. We used a combination of Dipole-Dipole and Gradient arrays for both true 3D and linear-measured 3D. All data inversion was completed in EarthImager™ 3D.
Data Collection
Survey Setup
As you saw above, the two types of surveys have slight differences in layouts. For true 3D, you will lay out your electrodes in a snake-like grid. For linear-measured 3D, you will need to set up a 2D line multiple times and ensure that each subsequent line is parallel to the last and has the correct line spacing.
Regardless of what type of 3D you’re doing, a good rule of thumb is to use line spacing equal to the electrode spacing or a maximum of twice the electrode spacing for a square grid of electrodes. This square grid will result in the best resolution for your 3D survey.
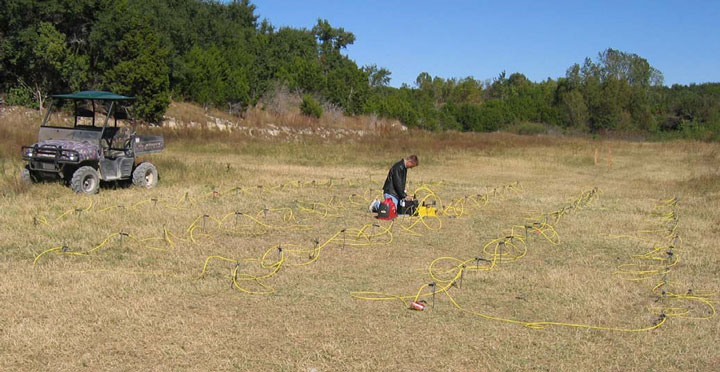
Above: An example of what a true 3D layout looks like in the field
Speed of deployment & data collection
One of the most interesting comparisons between the two survey types is the speed comparison. Basically, how long will it take you to do a true 3D or linear-measured 3D survey? Well, there are a few surprises in this comparison. It’s much like that old tortoise and the hare fable. Let us explain.
If you’re familiar with setting up for a 2D survey, those skills can be easily transferred to a true 3D survey. The only additional thing to look out for is getting your line spacing correct. All things considered, deploying a true 3D survey (in this example, 5 lines) would be quicker than deploying 5 separate 2D lines. However, in the data collection phase is where our tortoise and hare metaphor kicks in.
True 3D data collection can take up to twice as long as linear-measured 3D data collection. This is because true 3D requires additional geometries that can take a while to collect—even with an 8-channel device like the SuperSting™ R8. So even though you may save some time upfront by doing true 3D, it’s likely that if someone were doing the same survey in a linear-measured fashion, they would finish collecting all of their data before you. Keep in mind that 2D surveys are faster because they don’t take cross line measurements or have the additional geometry that true 3D does.
Another improvement which saves time is that 2D surveys can be fully checked in the field with EarthImager™ 2D which plots signal levels, error analysis, raw data smoothness and final model convergence. This can be done even before moving a line several times in a day. This allows fast repeats if an issue is discovered such as a disconnected electrode. Running 3D models takes more time and if a similar issue were discovered, repeating a portion of the area requires repeating the full 3D survey.
Depth achieved
Another interesting comparison is the depth that can be achieved by using the two survey types. True 3D doesn’t reach too far below the ground—but it’s really great for shallow-depth measurements. For instance, our test used an 84-electrode system with a grid of 5 x 17. This would be considered an above average system in terms of price, but our depth was around 4 meters.
For a 2D line—which is what linear-measured 3D consists of—we can achieve a far greater depth. Even a 56-electrode system doing a 2D measurement could achieve a greater depth of typically 70m or more with common maximum spacings of 6m compared to an 84-electrode system doing true 3D by multiple orders of magnitude. This typically makes linear-measured 3D the cheaper option due to much lower total numbers of electrodes being required.
Data Inversion
For this comparison, we’ve decided to compare line 3 between the two survey types. Please note that the two surveys were identical in terms of number lines and line spacing—which is critical to this comparison.
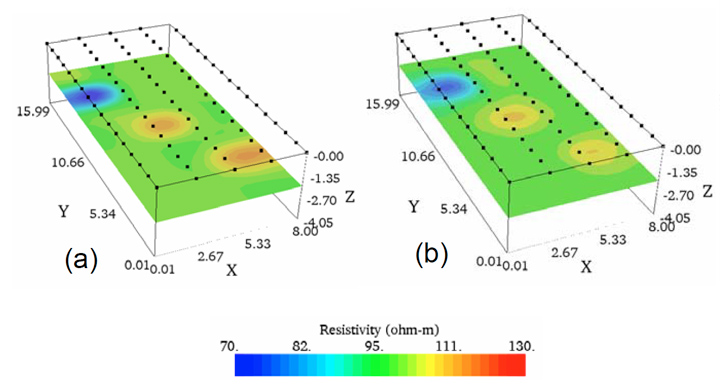
Above: Comparison of 3D inverted resistivity slice images obtained from (a) a true 3D data set of 7955 measurements and (b) a linear-measured 3D data set of 1071 measurements formed by five parallel 2D lines.
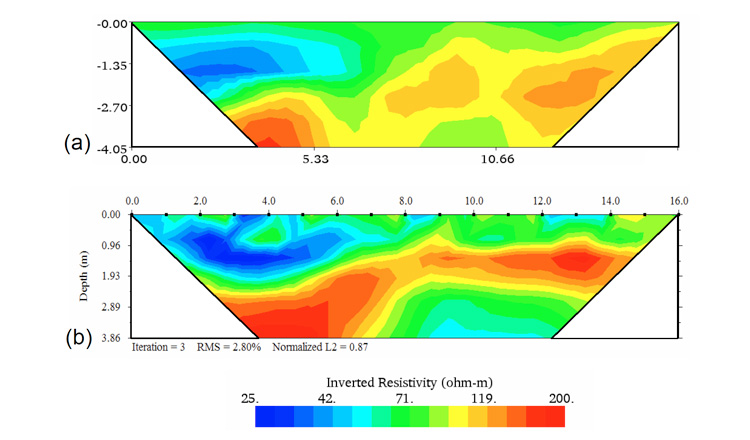
Above: Comparison of images obtained from 2D resistivity inversion at the central imaging section (Line 3).
Resolution
Though the true 3D survey collected eight times more data points than the linear-measured 3D survey, the resolution improvement is noticeable but not dramatic. The true 3D would still be considered the better option for resolution, but linear-measured 3D is not only acceptable, but highly defensible.
Volume
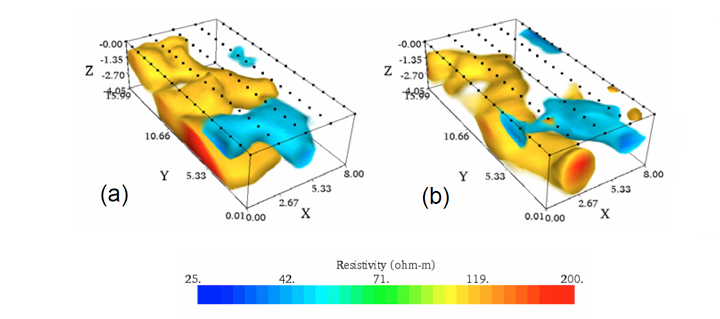
Above: Comparison of volume images of inverted resistivity obtained from (a) a true 3D survey and (b) a linear-measured 3D survey with five parallel lines.
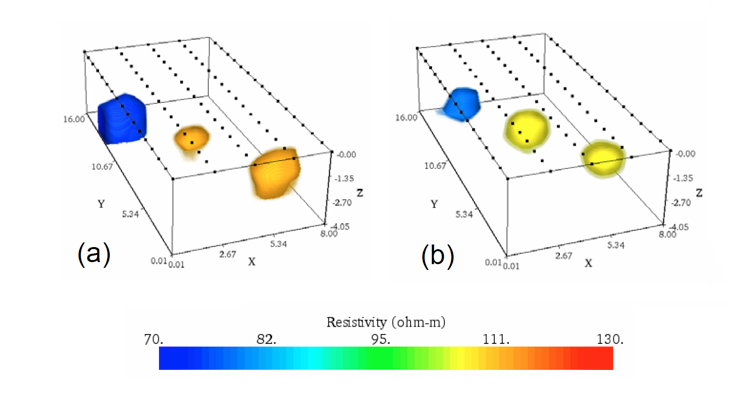
Above: Comparison of volume images of inverted resistivity obtained from (a) a true 3D data set of 7955 measurements and (b) a linear-measured 3D data set of 1071 measurements formed by five parallel lines.
Volume interpretation is probably where true 3D shines the brightest. Thanks to the high resolution of true 3D, it is easier to interpret volume when compared to linear-measured 3D. Again, linear-measured 3D is still an admirable substitute for true 3D.
Conclusion
With all things considered, let’s see how the two survey types compare.
| True 3D | Linear-Measured 3D | |
|---|---|---|
| Deployment Speed | Faster | Slower |
| Data Collection Speed | Slower | Faster |
| Survey Depth | Shallower Depths | Deeper Depths |
| Resolution | Comparable | |
| Volume Interpretation | Comparable | |
| Price | More Costs | Less Costs |
With these results, you can understand why linear-measured 3D has become so popular in the past few years. It’s the cheaper option with a faster survey time that gets results that are comparable to its true 3D counterpart.
So why would someone opt to use true 3D? Well, there are a few instances where the added resolution comes in handy. For example, a small and cohesive target such as vertical shaft or void space that comes to the surface at a known location can be very accurately mapped to determine which direction it trends by placing a 3D grid around it. In general, true 3D is most often used for shallow and well defined target locations where the highest possible resolution is needed and a slower acquisition speed with shallower exploration depth is within the goals of the project. Full 3D tends to be focused on determining the extent of a buried concrete foundation, archeological studies, tunnels and voids, infiltration time lapse studies, and other similar environmental and geotechnical projects. Again, linear-measured 3D can also be used for these projects, but true 3D will often maximize your return on investment.
Have any more questions about what kind of survey or equipment you need for your next project? You can always start a conversation with us here or on LinkedIn, Facebook, or Twitter.
