Electrode arrays are different arrangements of electrodes used to perform geophysical resistivity measurements. Electrode arrays were developed in order to make field measurements more efficient and data interpretation easier.
Today, we’re discussing the dipole-dipole array—this is the third article in our series exploring 11 electrode arrays and methods. We’ve also covered the following:
What is the dipole-dipole array?
A dipole is a pair of oppositely charged electrodes that are so close together that the electric field seems to form a single electric field rather than a field from two different electric poles. (On the other hand, when the separation of the two charged electrodes is large enough that the observer detects the electric field from two poles, it’s called a bipole.)
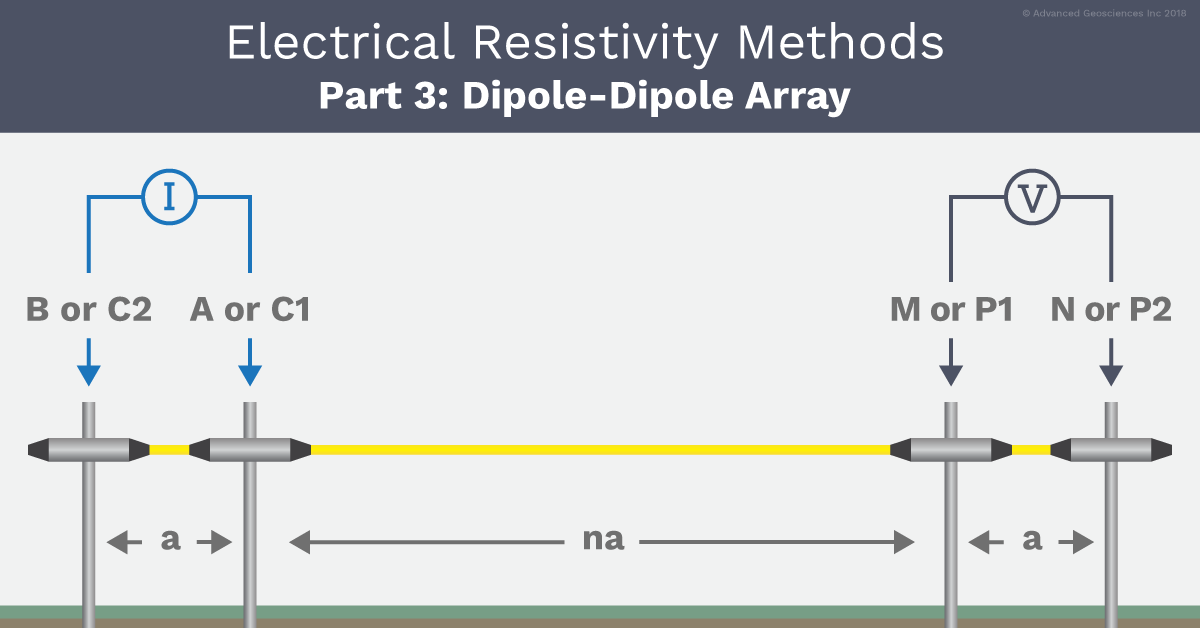
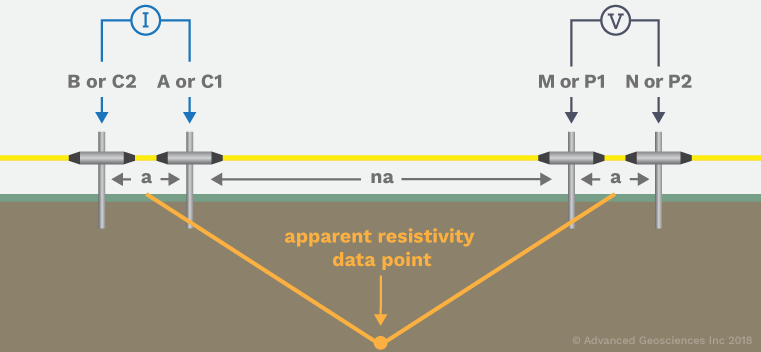
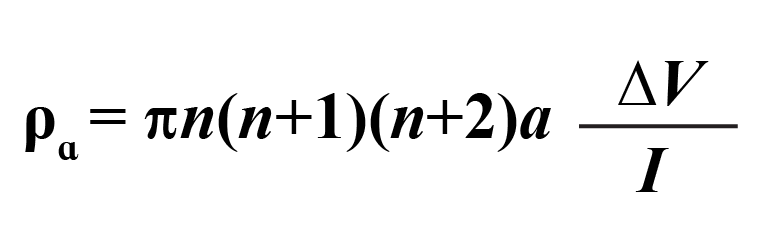
The dipole-dipole array consists of a current electrode pair A and B and a potential electrode pair M and N, and it offers a way to plot raw data in order to get an idea of a cross-section of the earth. Those using the dipole-dipole array look at a measurement value called apparent resistivity, which represents a weighted average of the resistivities under the four electrodes used to take the reading. The apparent resistivity is typically calculated by modern instruments from the geometry between the four electrodes and the injected current and measured potential.
The result of a dipole-dipole survey is plotted in a pseudo-section. For each measurement, the apparent resistivity data is plotted at the midpoint between the two dipoles and at a depth half the distance between the two dipoles.
The value is finally contoured and colorized, which represents a rough (and often severely distorted) image of the subsurface. So while this array doesn’t provide an actual image of the ground, the data points resulting from these measurements provide an image of the cross section that one can then try to interpret. Today, modern inversion software (EarthImager™ 2D) can recalculate all of these apparent resistivity values to “true” resistivity values so that a realistic image of the ground can be created.
The primary advantages of the dipole-dipole array are its high resolution and multi-channel capability; it provides a very detailed image instead of providing a “big picture” image like the Wenner array.
The dipole-dipole array is fast because it supports multiple receiver channel measurements simultaneously (the AGI SuperSting R8 can measure eight simultaneous measurements for each current injection) whereas the Wenner array can only collect one data point for each current transmitter injection. Additionally, it is relatively simple to perform a survey along profile lines using the dipole-dipole array. The disadvantage of this array is that the dipoles will lose the signal if they’re placed too far apart, thereby decreasing the ability to see deeper into the earth.
Background
The dipole-dipole array was originally used for mineral exploration with the induced polarization (IP) method. The dipole-dipole method made it easier to visualize the collected data in the form of 2D handmade contour plots. Even though you couldn’t get a perfect image of the ground, it gave you an approximate image which you could interpret the geology from.
As previously mentioned, the big change with the dipole-dipole array came with automated resistivity and IP imaging (where raw data is collected automatically and inverted (computer-modeled) into true IP and true resistivity, which we’ll examine below).
Using The Dipole-Dipole Array With Modern Resistivity & IP Scanning Instruments
To conduct a survey using the dipole-dipole array, you first place a large number of electrode stakes out with equal spacing between the stakes. For example, you could have 100 electrodes, each spaced one meter apart. If this were the case, you’d have a 99-meter-long profile. With spacings at 10 meters apart, you’d have a 990-meter-long profile. The longer the profile, the deeper you’re able to see—at a cost of less detail in the image. After all the stainless steel electrode stakes are installed in the ground and connected with one multi-conductor cable to the AGI’s SuperSting instrument, you then start the measuring sequence.
The electrodes in positions one and two are your current electrodes, labeled A and B. The electrodes in positions three and four are your potential electrodes, labeled M and N. The instrument takes a reading referred to the mid-point between the current and potential dipoles. Once that is complete, the instrument automatically moves the potential electrodes (M and N) to the electrodes in positions four and five. (The electrodes stay in the same place physically, but the instrument connects with a different pair of electrodes.)
This process repeats—electrodes A and B stay in positions one and two while M and N move out one electrode spacing for each reading. For every step out, the signal becomes weaker. At a certain point, the instrument can no longer take a reading. At this point, the instrument automatically moves the current electrodes A and B out a step—from positions one and two to positions two and three. This cycle continues throughout the electrode array. Using the SuperSting R8, you can conduct a field survey in roughly 15 minutes (instead of the two or more hours another system may take, which decreases the costs of time in the field.)
Keep in mind that modern equipment and software allow you to perform multiple arrays at one time. Using the SuperSting instrument, you could perform a combination dipole-dipole and Schlumberger (Gradient) array at once to allow you to see depth and detail even better.
Resources & Related Information
Questions about the dipole-dipole array?
We’d be happy to respond to any comments or questions you have about the dipole-dipole array or any other arrays. Simply fill out the form on this page, and we’ll be in touch.