- Office Hours: M-F 8:30 AM - 5:00 PM
Near Kütahya Province, Turkey—a landslide occurred during the construction of a waste dam. The area's geology was comprised of clay, sandstone, marl, and limestone—all of which have less-permeable or impermeable features. Electrical Resistivity Imaging (ERI) profiles were needed to determine the landslide geometry and to map areas with high-risk potential.
11 parallel 2D lines—with the lines spaced at 20m—were made on the slope of the landslide. Then, 2D data was collected with 42 passive multi-electrodes with 10m electrode spacing using a Dipole-Gradient array. This array was used with a SuperSting™ R8/IP and an 84 electrode SwitchBox. The obtained 2D field data was then processed with EarthImager™ 2D. Finally, the combined 11 parallel lines were inverted in EarthImager™ 3D.
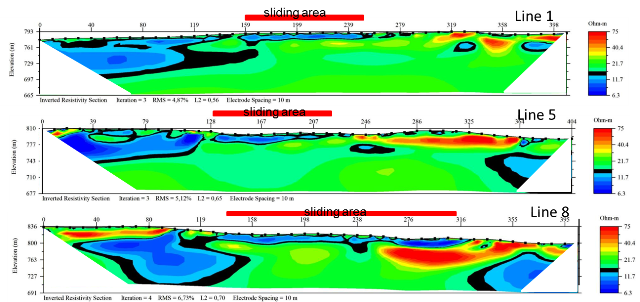
The survey successfully revealed risky areas at the survey site. The section determined by the black contour line in the 2D section (See image titled "2D Sections" by clicking the image to the right) is considered as the unit with slip potential. The area between 59m and 249m on Line 1 is the ongoing boundaries of the sliding zone. The other sliding zones are highlighted on each 2D section. Although the unit on the left side is the same, the lower-upper unit relation, the chemical component differences seems to be stable due to topographic inclination.
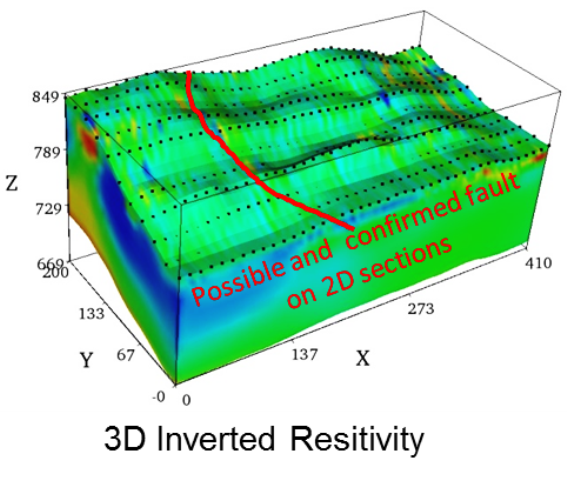
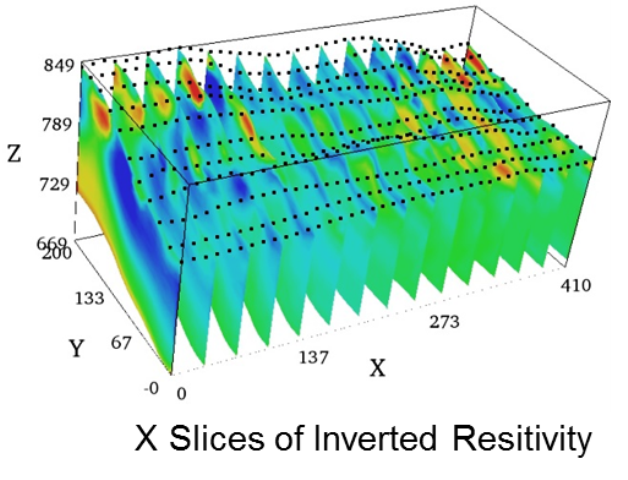
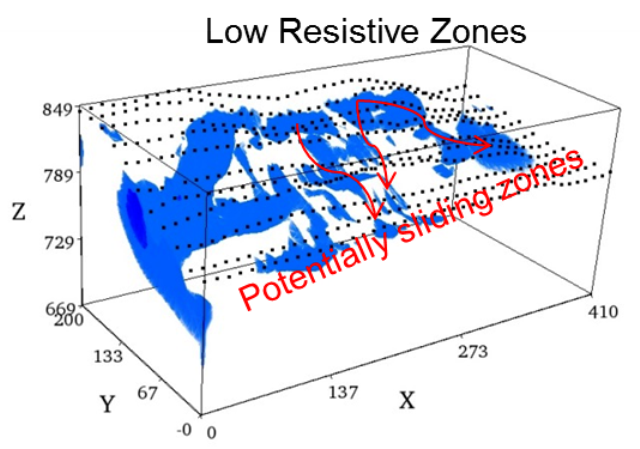
The 3D volumetric image and X-coordinate slices (click the image to the right to view) determine the depth, thickness, and lateral variations of the low-resistive weak clay zones and zones with potential for further landsliding. Resistivity values between 35 and 75 Ohm-m with sand/sandstone intercalation units. We can also see that clay/claystone and marl alternation units are followed by sandstones.
The existence of the fault is not clear, as determined. On the left side of the sections, one of the factors determining the boundary of the sliding plane was determined as a fault. According to the fault line, the left coast is elevated and the right side represents the fallen blocks.
Data courtesy of: Ali Karan, YGH MÜHENDİSLİK LTD. ŞTİ www.alikaran.com