- Office Hours: M-F 8:30 AM - 5:00 PM
In 2019, ECA Geophysics completed a geophysical investigation which spanned an approximate 65-acre tract of land. The undisclosed survey site was situated somewhere in North America. The client wanted to image the surfaces of the Tertiary and deeper Precambrian bedrock. Successful imaging would be used to help other contractors better determine optimal recovery-well locations within the glacial/alluvial aquifer above these bedrock units. ECA Geophysics opted to utilize Electrical Resistivity Imaging (ERI) to obtain image the subsurface.
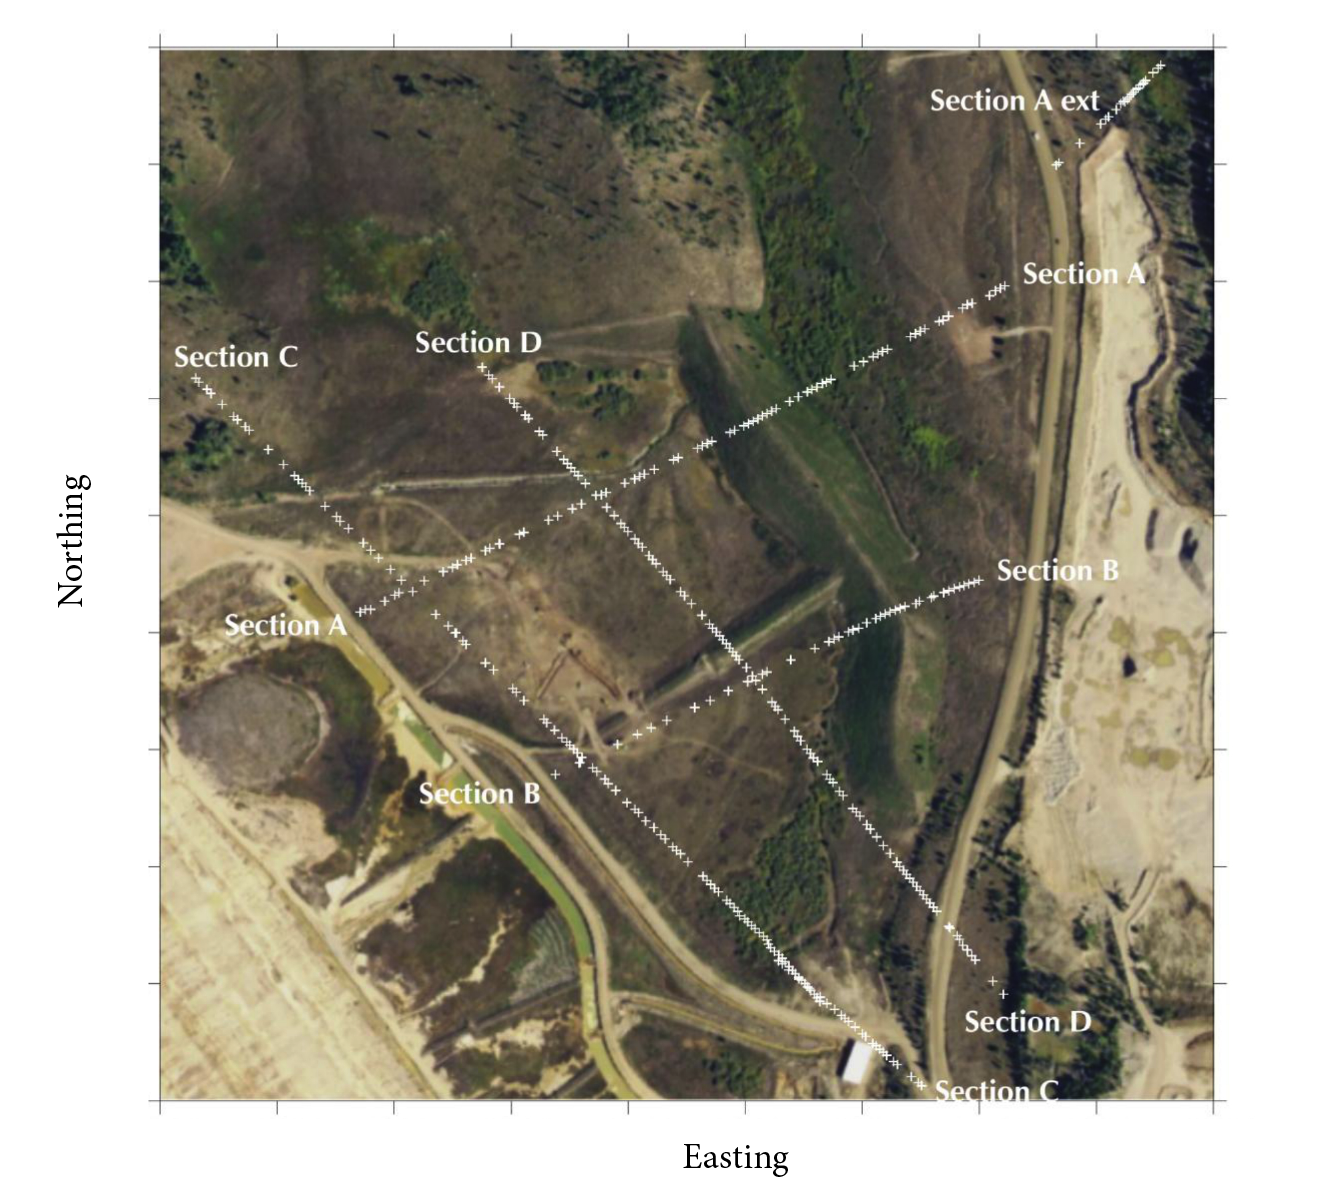
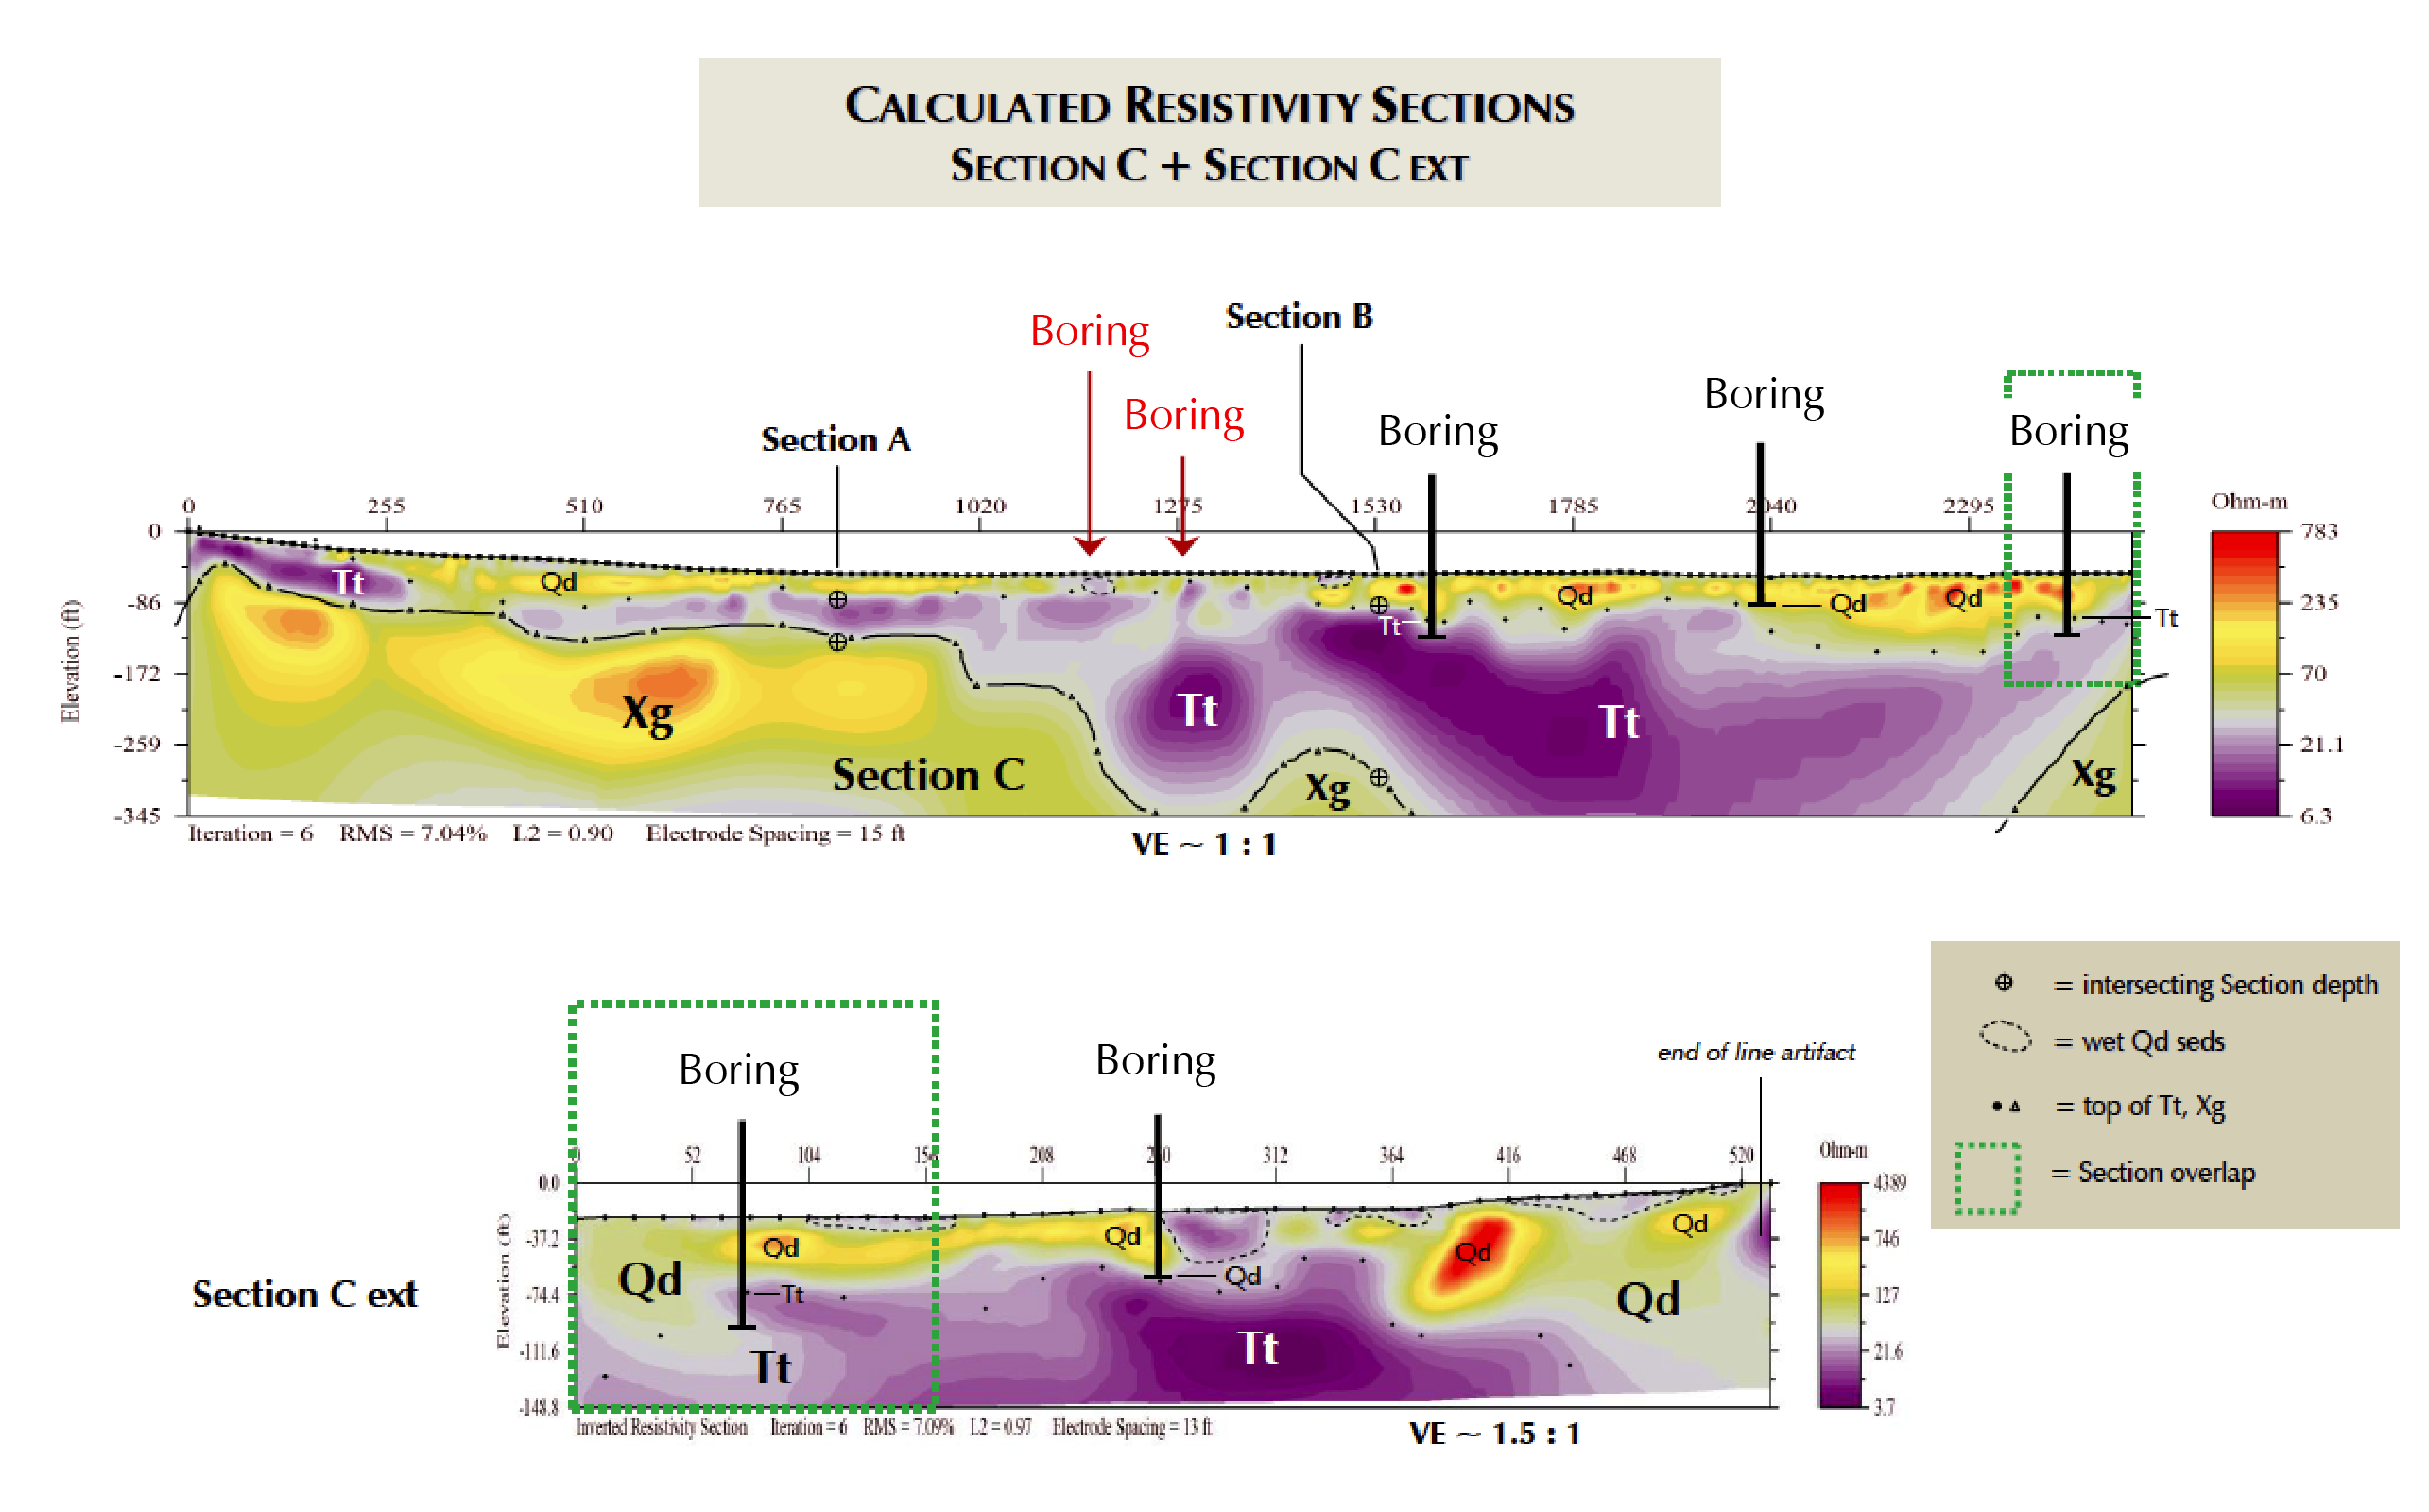
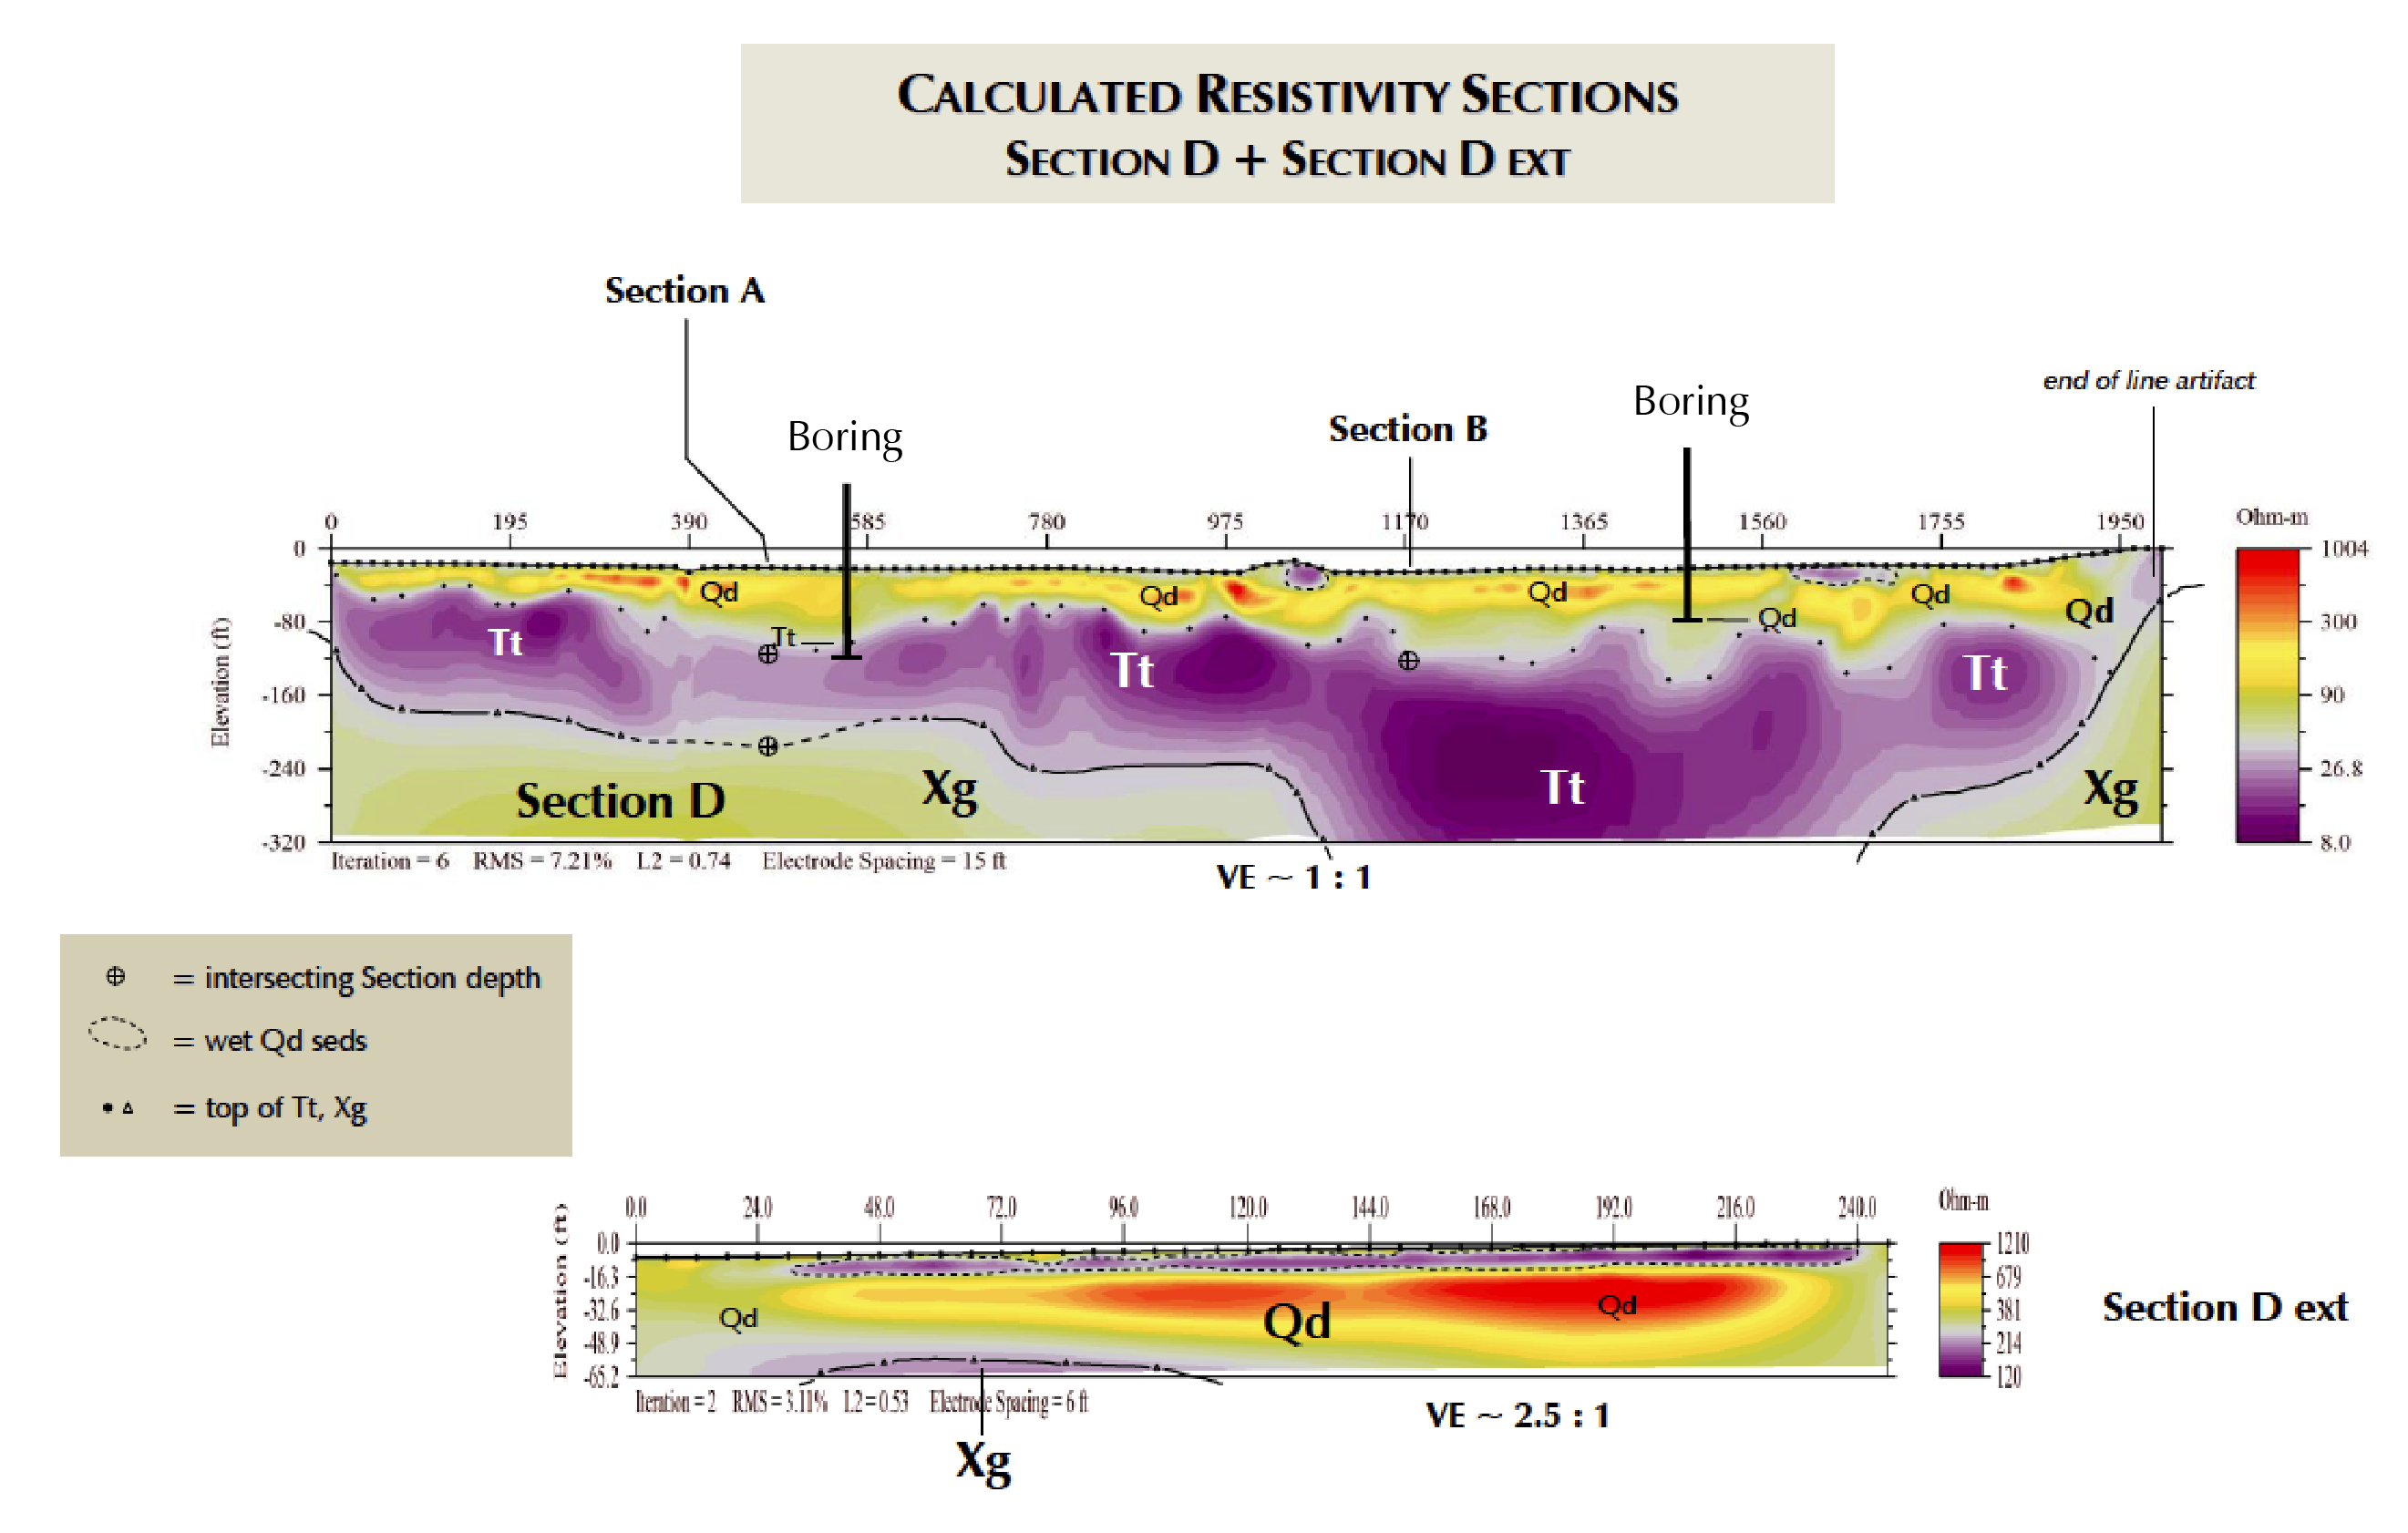
The SuperSting™ R8/IP system was utilized to acquire the resistivity data for this field investigation. The Trimble Geo 7x™ Global Positioning System (GPS) was utilized to gather accurate horizontal (locational) coordinates and elevations for slope changes that occurred along each linear resistivity array (section). To properly image the bedrock surface that occurs as deep as 175 feet, an energy penetration depth exceeding 300 feet was achieved, to provide adequate data coverage midway through the subsurface section. Inspection of the calculated resistivity sections reveals that the long linear resistivity arrays (Sections A – D) adequately sampled the upper 320 to 345 feet, whereas the short linear resistivity arrays (Section A ext, Section C ext and Section D ext) sampled the upper 65 to 119 feet of the subsurface. The exact locations and extent of all seven resistivity arrays are shown in Figure 1.
Slope changes along each 42-electrode (short) and 84-electrode (long) resistivity array were measured, utilizing a GPS system that provided locational and elevation accuracies at ± 1 foot accuracy or better.
(Note: All images can be viewed larger in the image gallery)
 |
 |
 |
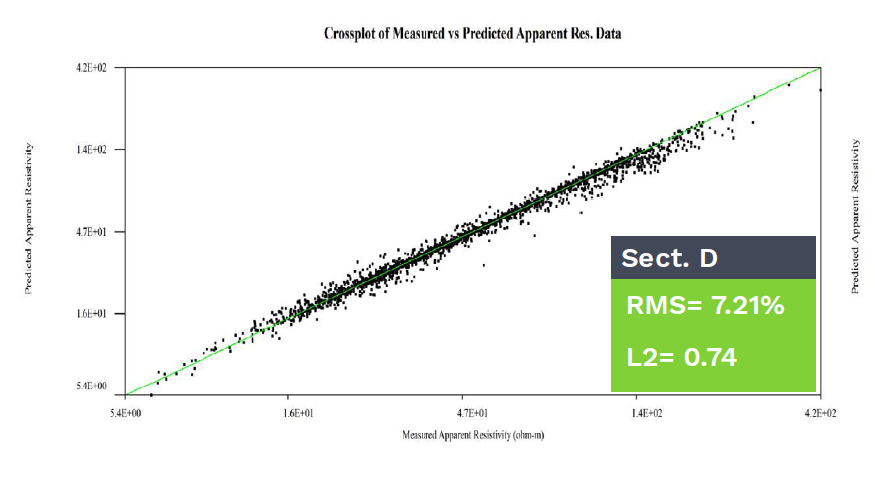 |
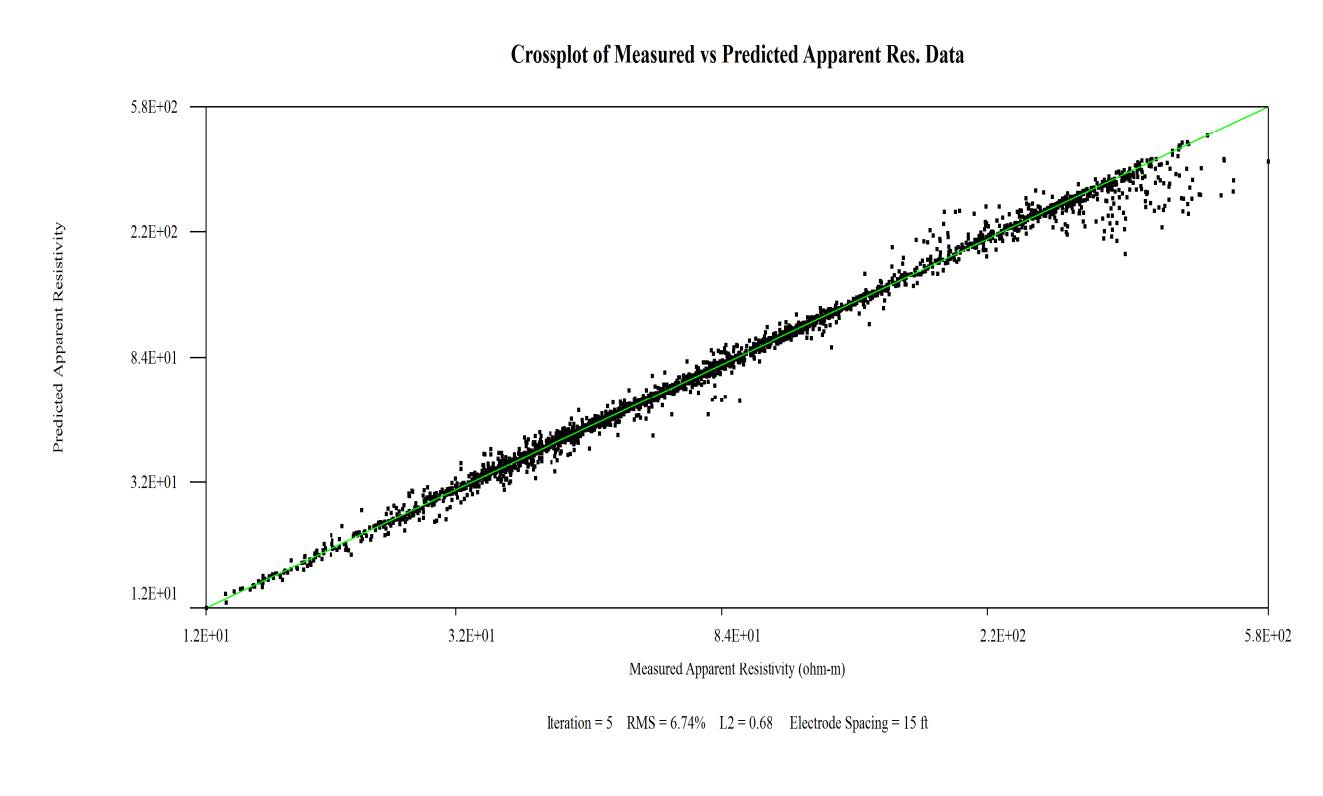
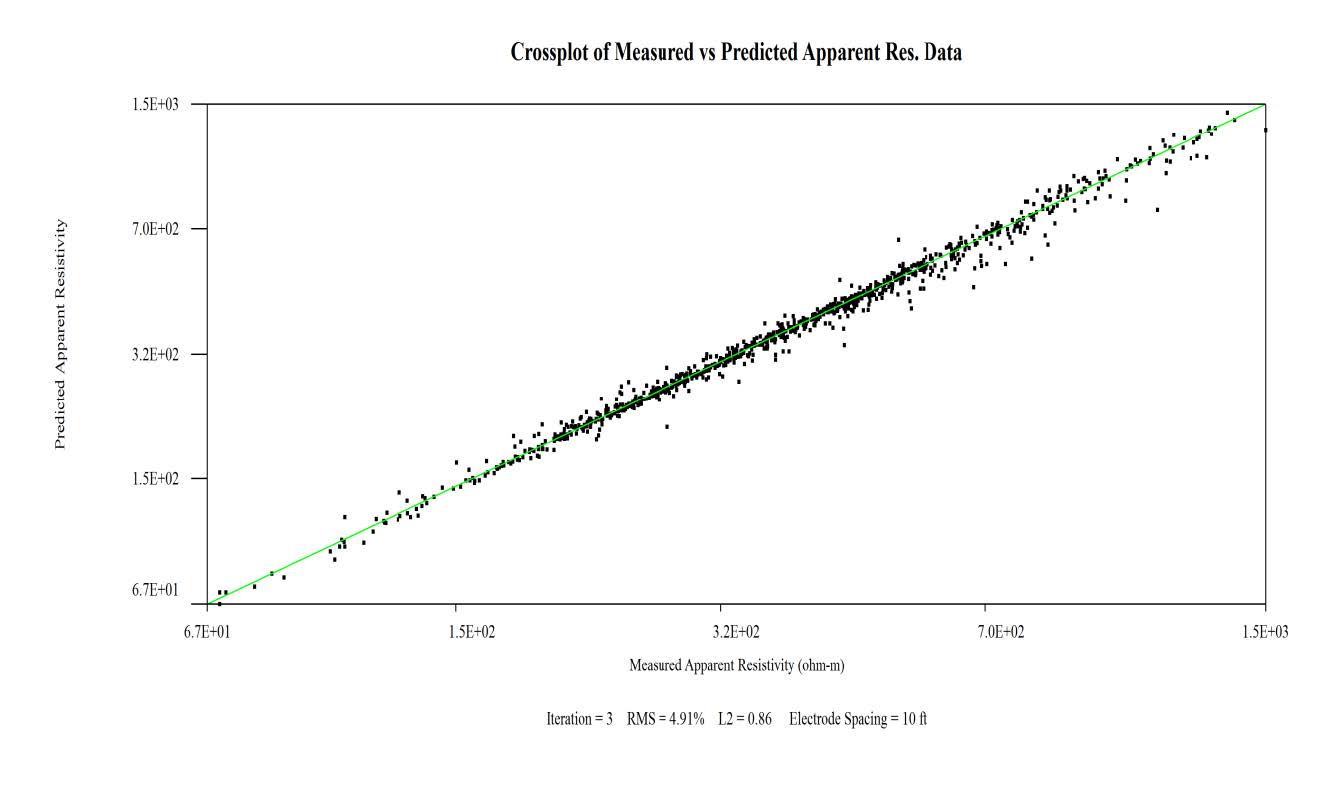
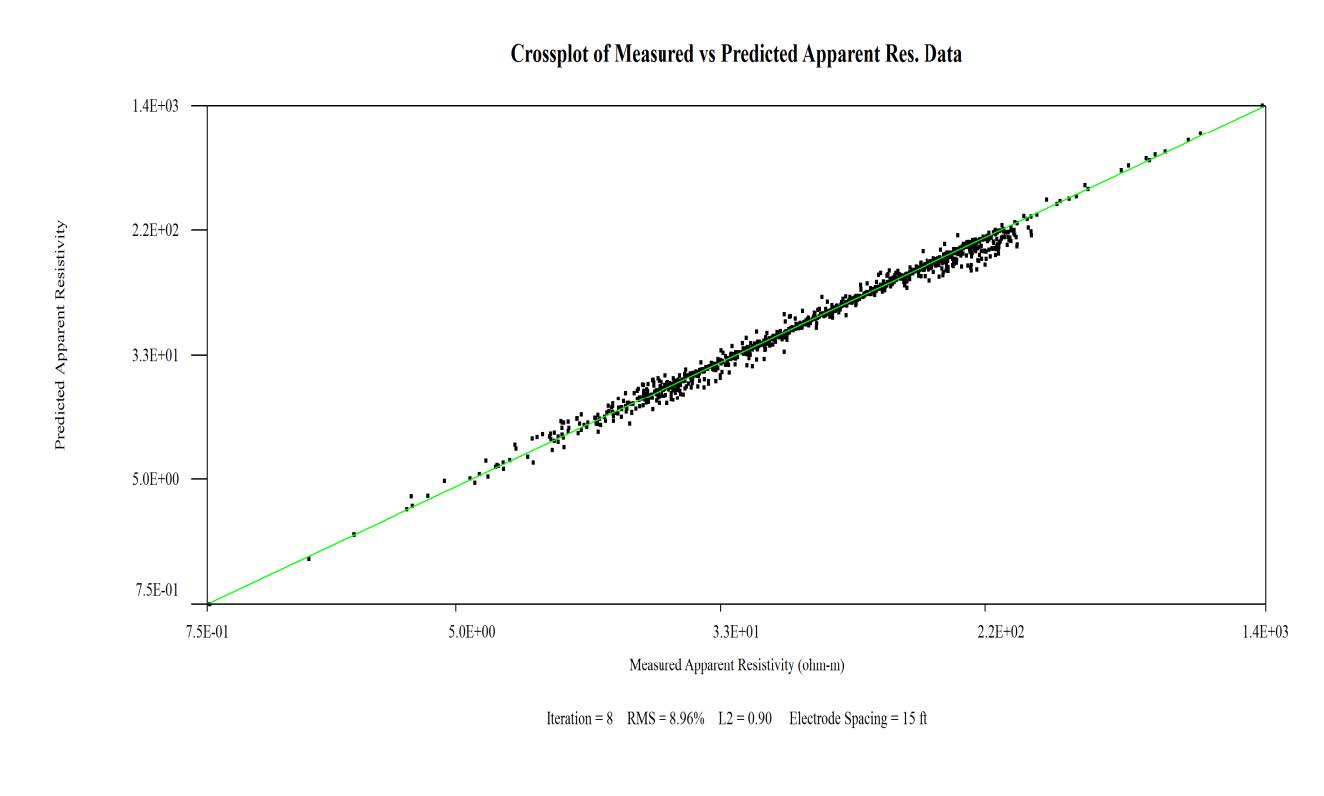
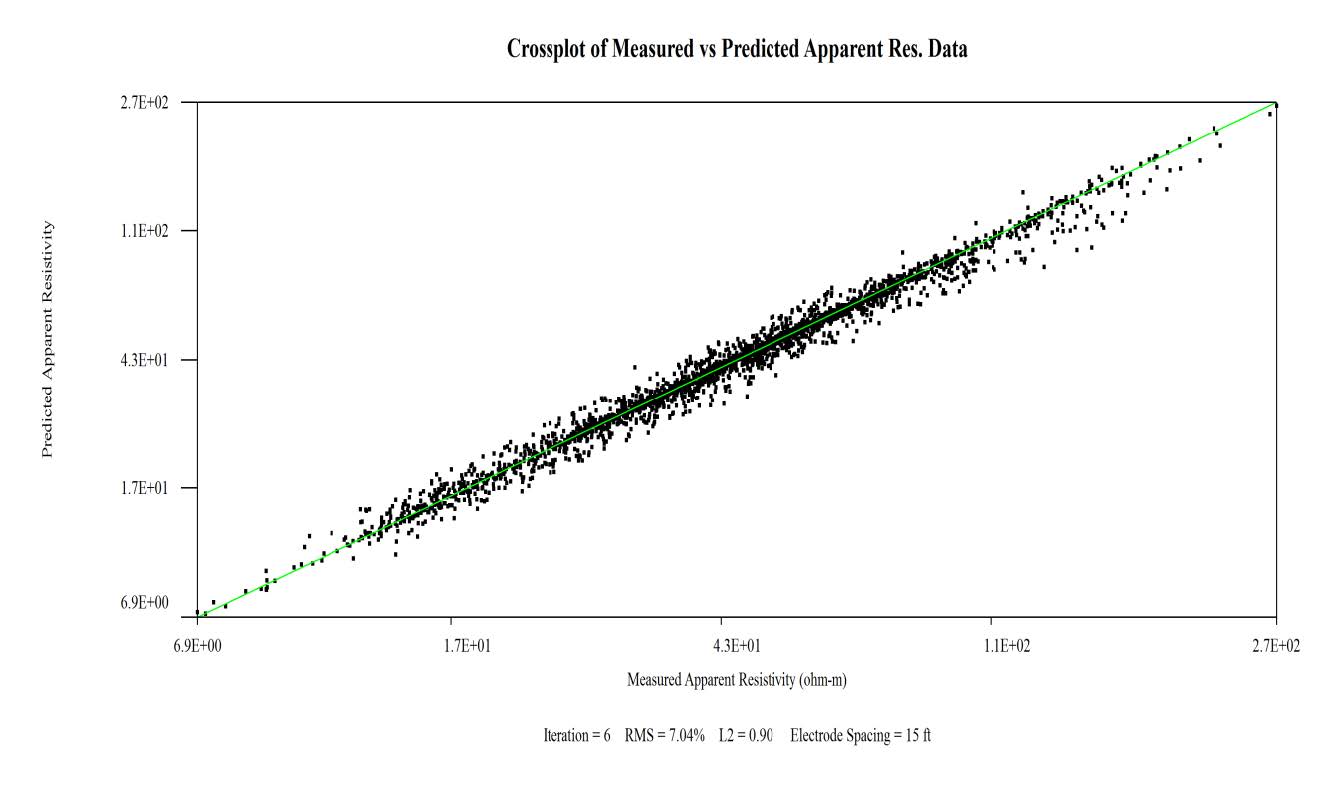
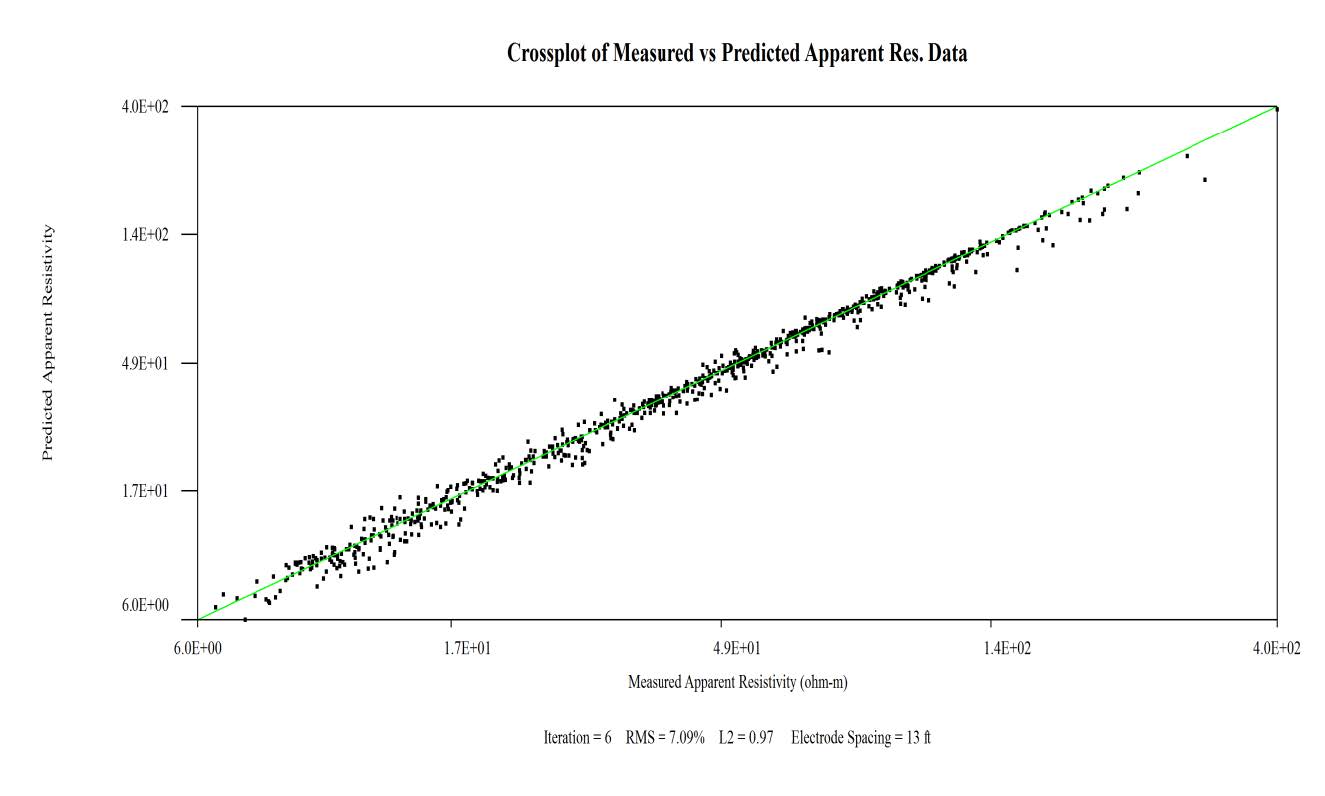
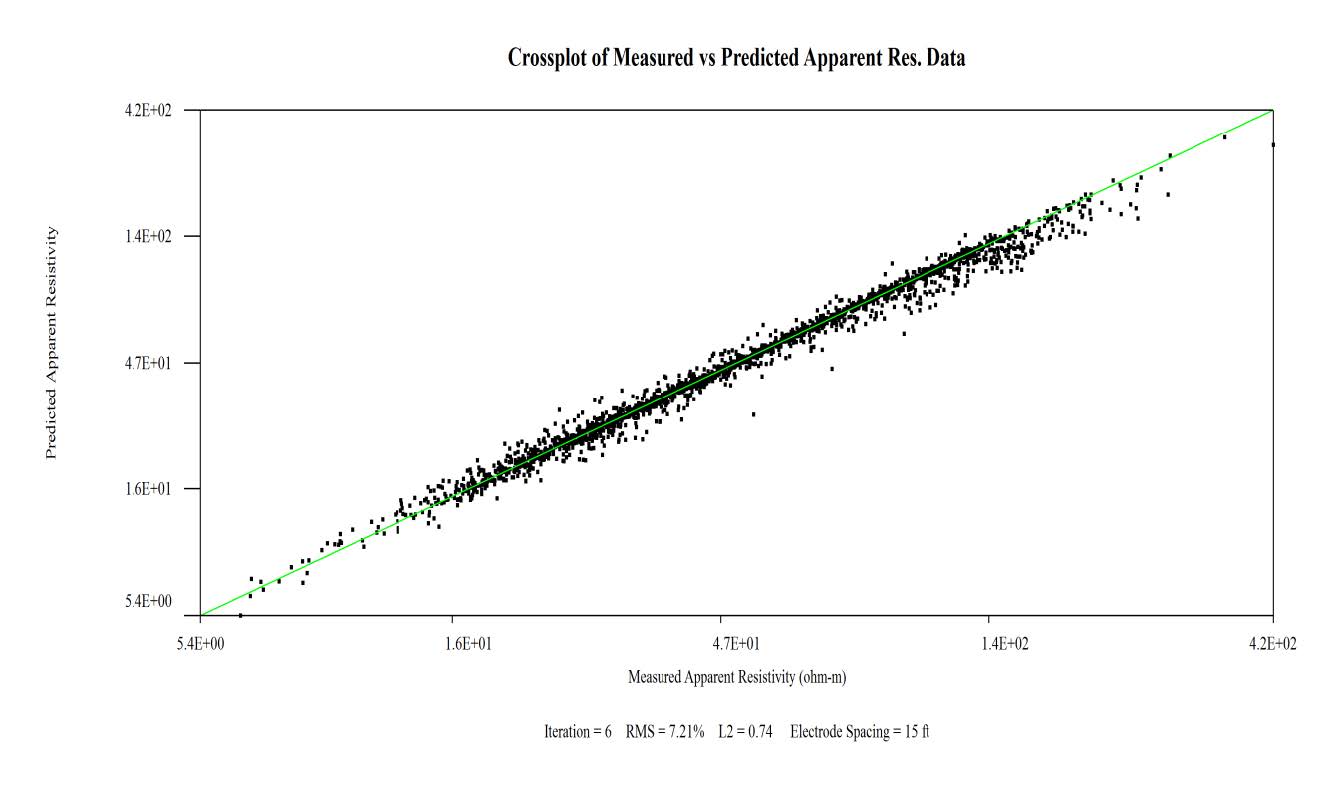
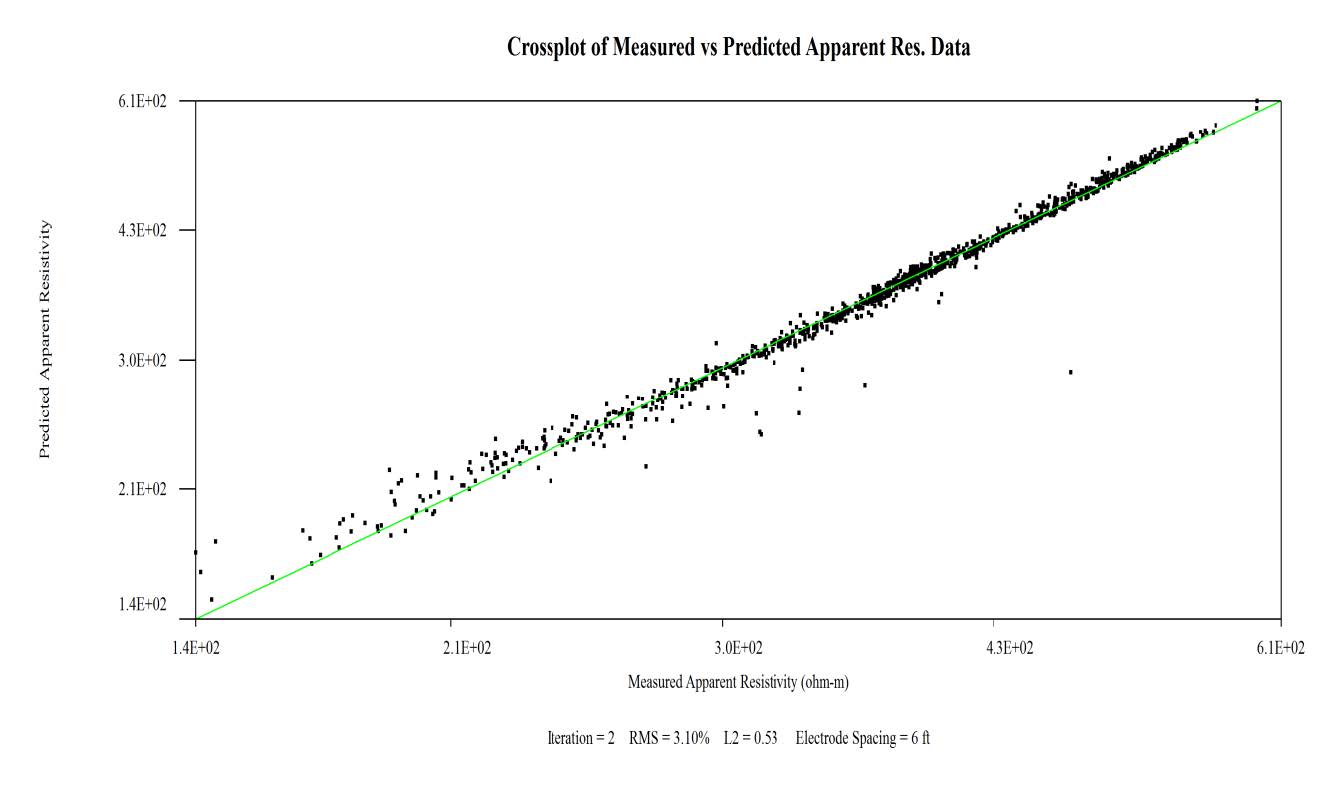
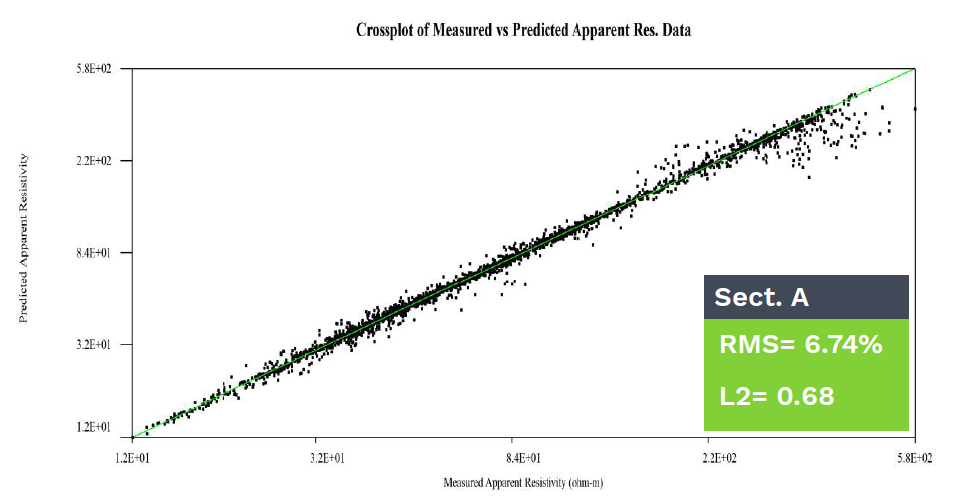
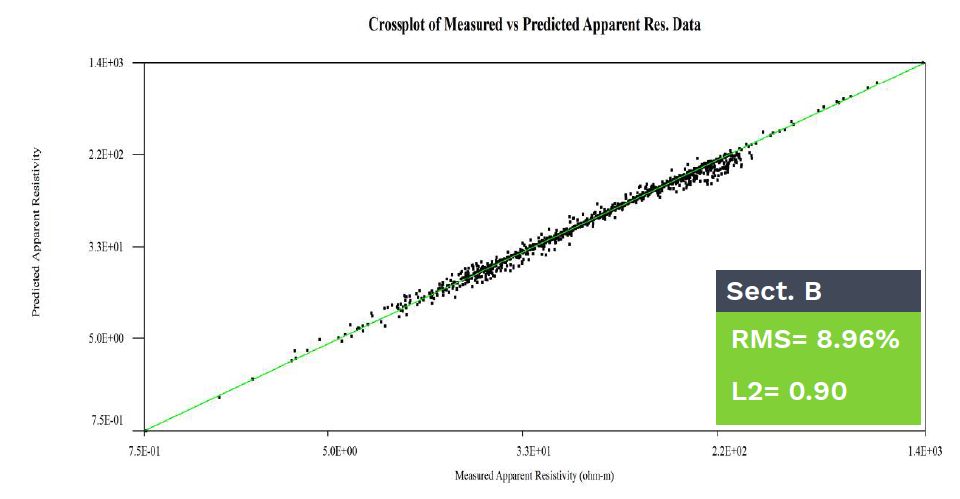
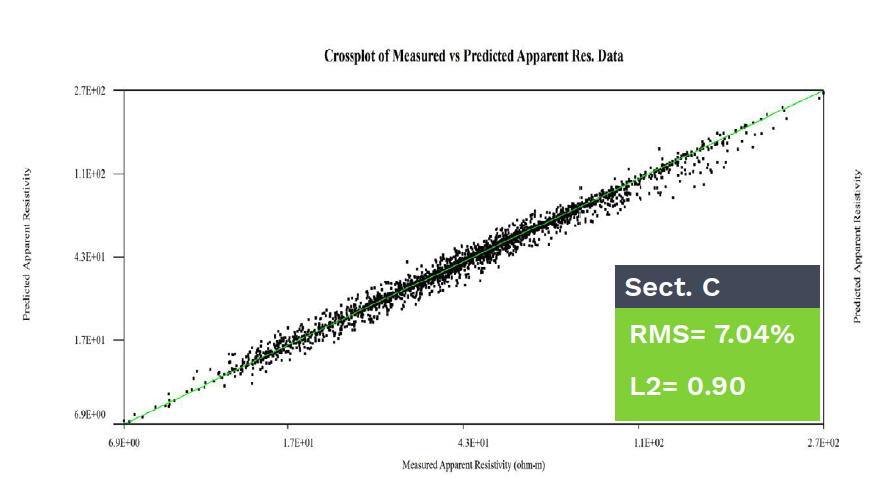
The forward and inversion modeling of the acquired data was performed using Advanced Geosciences, Inc.’s EarthImager 2D™ software. During the data modeling process for each array, a Data Misfit Crossplot was displayed, to check how well the calculated (predicted) apparent resistivity fit the corresponding measured apparent resistivity. A perfect predicted versus actual apparent resistivity fit occurs along the diagonal green line displayed in the crossplots. Acceptable data misfit or “goodness of fit” occurs when the maximum RMS error is less than 10 percent and “L2” (another data misfit indicator) is less than 2. The very low RMS errors (under 9 percent) and L2 values (under 1.0) for all models indicate high-quality inversion results.
A comparison of the seven sections reveals that data repeatability is good, in that similar-looking subsurface anomalies exist and line up in a geologically plausible manner. Such displays are more than likely caused by subsurface features and not by artifacts generated during data acquisition and/or data processing.
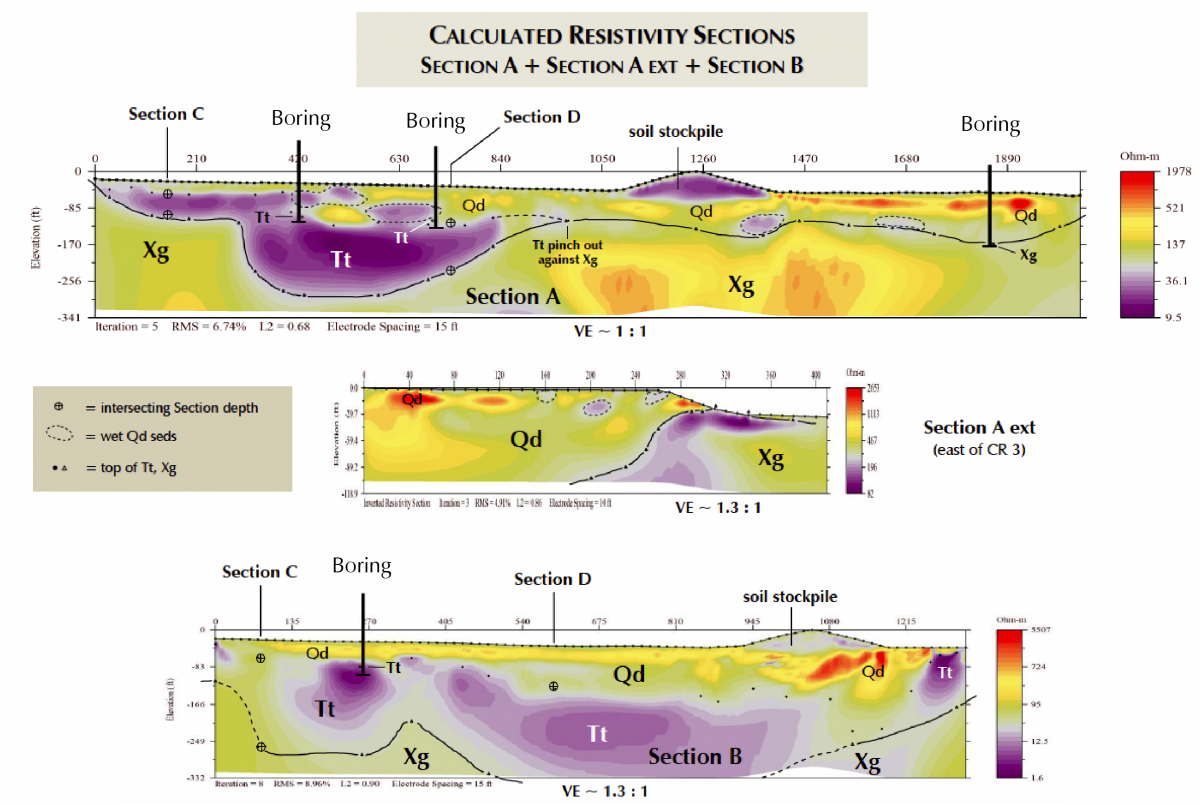
Above are the calculated resistivity sections for Section A, Section A extension and Section B. Black dots, triangles, and lines represent careful picks taken on contours of constant resistivity along the surface of the Tt Formation and bedrock (Xg), respectively. Open crossed circles represent the depth to Tt or Xg for an intersecting Section. Transects are oriented roughly WSW-ENE (left – right). Only two nearby boring logs were available from which to make fair-at-best bedrock surface (Xg) correlations. Accordingly, the Xg picks were based upon simple geologic positioning, where the bottom of Tt was assumed to be the top of Xg. Additionally, top of Xg was assumed to be coincident with deep and high resistivity values, such as the noticeable yellow-colored feature in Section A.

Correlations of the interpreted Tt and Xg surfaces were made at the intersections of the four main sections with one another. Reconciling the 16 intersectional Tt and Xg ties resulted in smoother three-dimensional Tt and Xg surfaces. Nonetheless, with resistivity data resolution of ~ 8 feet (half the electrode spacing) and a typical “picking accuracy” no better than ~ 6 feet (even using zoomed-in section displays), the accuracy of a typical depth pick is approximately ± 7 feet. All (especially Tt) picks were made along color contours of constant resistivity. The color contours were selected from careful correlations with the geologic “picks” provided by the best available (and closest) borehole data.

Inspection of Sections A through D reveal that an adequate correlation exists between the resistivity data and boring logs for holes drilled nearby the resistivity arrays. For instance, reasonably close to very close resistivity data – borehole data correlations enabled higher-confidence Tt surface picks throughout the extent of each resistivity model.
Data courtesy of: ECA Geophysics