- Office Hours: M-F 8:30 AM - 5:00 PM
In August 2015, Pyramid Environmental was contracted to estimate the cubic yards of sandy soil valuable as a construction aggregate on the 230 acres of undeveloped land in North Carolina.
The purpose of the electrical resistivity survey was to quantify the lateral extents and approximate depth of sandy soils near the ground surface. The client wanted to understand the potential of the site to be utilized as a sand mine as well as the potential yield of sandy soils.
Prior to the geophysical survey being conducted, shallow soil borings were performed to obtain physical soil samples across the property in order to provide a direct sample (ground truth data).
These soil borings indicated that sandy soils—a mix of sand, silty sands, and clay sands—started at ground surface and had a range of thickness across the 230 acres roughly between seven and 30 feet. These samples provided a baseline for the geophysical analyses—but Pyramid wanted to extend the information with modeled data.
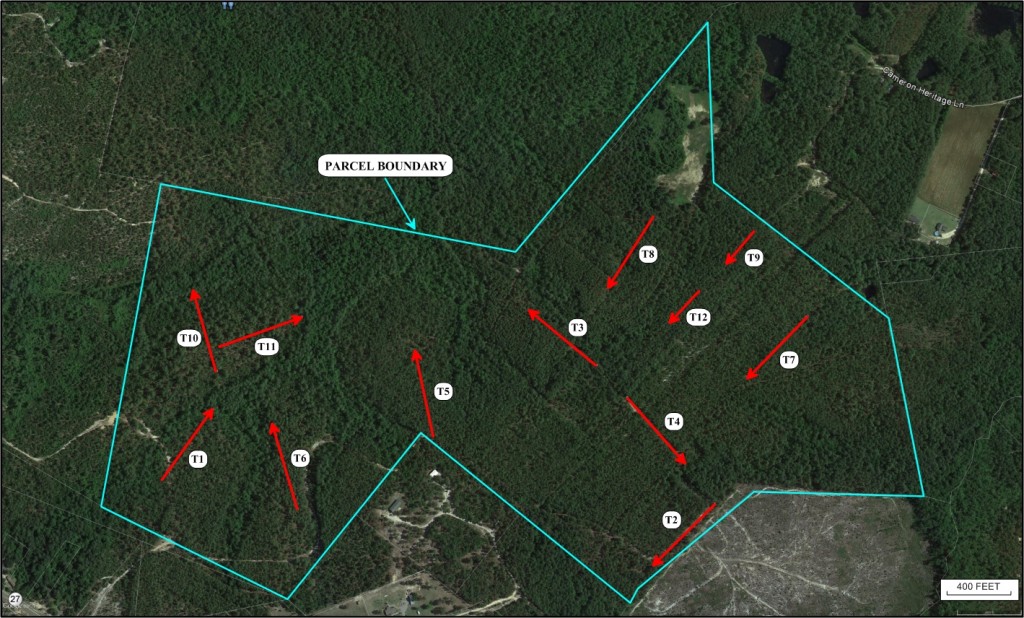
Using AGI equipment, Pyramid performed a total of 12 electrical resistivity surveys, which provided a good understanding of the geologic conditions across the 230 forested acres, up to depths of approximately 110 feet.
The results indicated four main geologic strata, which characterized the subsurface across the property:
Stratum 1: High-resistivity (2,000+ Ohm-m) dry sandy soils with varying percentages of fines in the upper ~2 to ~50 feet.
Stratum 2: Mid-resistivity (500-1,000 Ohm-m) dry clayey soils with variable sand content directly underlying the sandy soils.
Stratum 3: Low-resistivity (<1-500 Ohm-m) saturated clayey soils underlying the dry clay soils.
Stratum 4: High-resistivity materials (sand or rock) below the water table in the lower portion of most profiles.
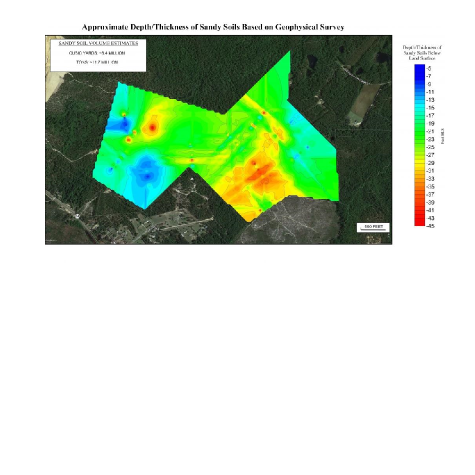
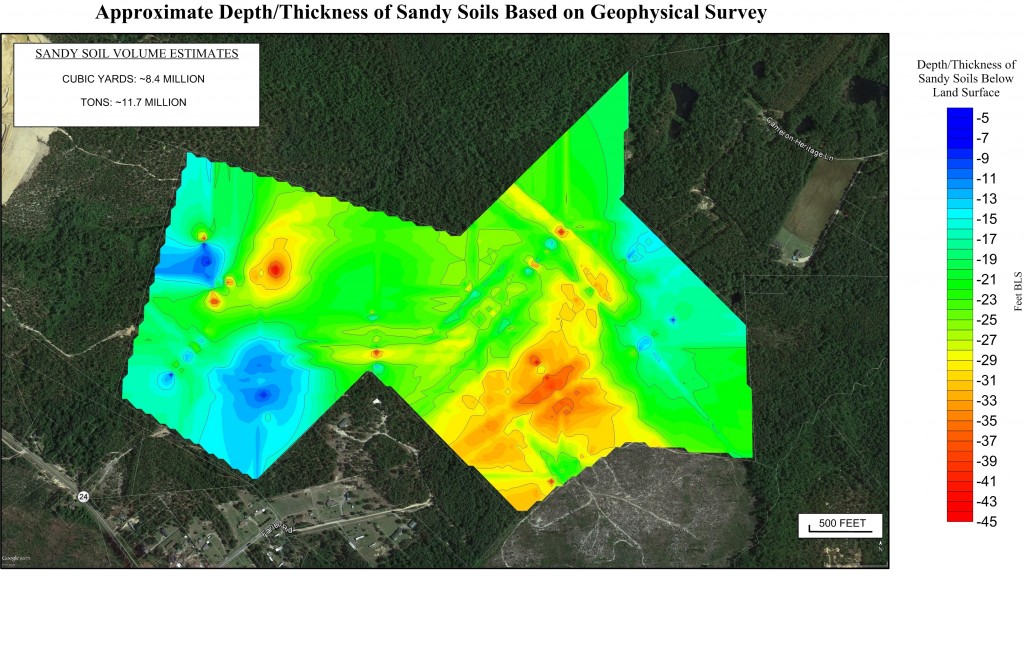
Stratum 1 was considered to be the soil that could potentially be used for mining purposes. The resistivity data was analyzed and depths of viable sandy soils were extracted from each transect to generate contour maps of the sandy soils across the property. The contour maps (see image right) helped show the average thickness of the sandy soil unit and specific locations with potential increased or decreased volumes of sand.
Detailed understanding of geologic conditions: This information was obtained in a short amount of time without having to perform a significant number of additional soil borings, which would have resulted in exponentially higher costs to the client and additional time to study the results.
Eliminated gaps in the data set: The geophysical survey eliminated gaps that would have otherwise been present if the only approach was using borehole data. The project shows the benefit of using geophysics in conjunction with physical soil samples to effectively characterize a project site in a short amount of time.