One-dimensional (1D) resistivity surveys are not ideal because they assume that the geological layers are horizontal and homogeneous—which is rarely the case. Two-dimensional (2D) resistivity surveys are an improvement but still an approximation, as they assume the geology continues infinitely in both directions perpendicular to the survey line. While this method is more accurate than the 1D Vertical Electrical Sounding (VES) method, it is still inadequate.
Three-dimensional (3D) resistivity surveys are the perfect solution. They measure resistivity from a grid of electrodes or a number of parallel lines, that cover a large surface area, but can also include underground electrodes in the case of borehole measurements. The electricity flows from one electrode to another and penetrates the ground in a number of different directions. Once the survey is complete, a true resistivity model of the surveyed area is calculated with very few limitations.
Benefits & Use Cases Of 3D Resistivity Surveys
The primary benefit of a 3D resistivity survey is that it measures in all directions. This makes it more accurate and reliable than both one-dimensional surveys and two-dimensional surveys.
The other major benefit of a 3D resistivity survey is that it allows you to calculate volume. This is critical for a number of use cases, and can lead to significant cost savings. For example, a 3D resistivity survey for mineral exploration not only shows precisely where the minerals are—but also provides the necessary data to calculate the volume of the mineralization. This allows the company procuring the survey to run an accurate cost-benefit analysis.
Additionally, a 3D resistivity survey can help calculate the volume of in-ground pollutants. For example, when drilling for oil, companies often hit brine (highly saline water) fields. The objective is always to contain these breaches, but sometimes the brine spills on the surface or underground, which can be very harmful to the environment and any drinking water supply. A 3D resistivity survey would allow the oil company to see a three-dimensional picture of where the low resistivity plume is—thus, the highly salinated area—and work to remedy the issue.
Limitations Of 3D Resistivity Surveys
There are two disadvantages of a 3D resistivity survey: the cost and the labor. For example, a two-dimensional survey may require a single line with 100 electrodes—but if you want to keep this same length and width for a 3D resistivity survey (i.e. 100x100 electrodes) you would potentially need 10,000 electrodes. As you can imagine, this is a nearly impossible task—but there are ways around this (see below).
Corresponding Technology
While 3D resistivity surveys may be more costly and labor-intensive, the right tools can offer a way around this dilemma. Since resistivity doesn’t change rapidly, you can take 100 electrodes or less and record a single line of resistivity data. Then, move the line one electrode spacing over—and repeat this process until you’ve surveyed the entire area. Using AGI’s EarthImager 3D technology, you can then process the data to get a complete 3D image. This is ideal for small-to-midsize businesses that need a three-dimensional survey but can’t cover the cost of the full 3D electrode grid.
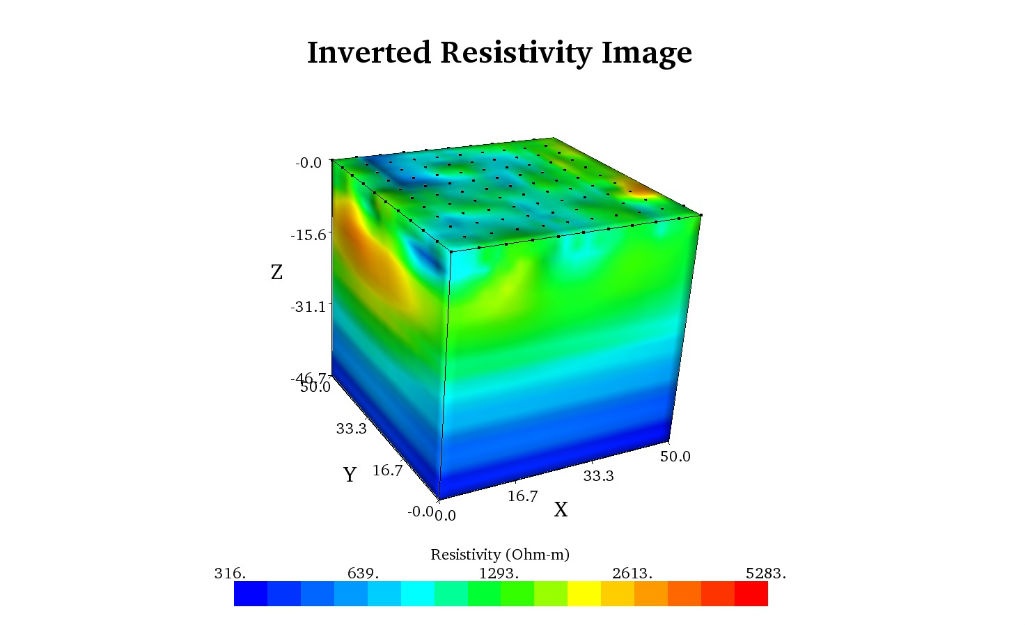
Whether you choose to create your 3D survey line-by-line or with a full grid of electrodes, EarthImager 3D has a number of other helpful features. For example, EarthImager allows 3D visualizations of resistivity levels with color charts for the surveyed area. The software allows users to remove particular colors—say, all colors that signify low resistivity—to show a particular volume of interest. This can be done as a constant surface of resistivity or by making any resistivity partially or fully translucent. Additionally, the user can move the cube (e.g. the surveyed volume) around and take slices in any direction or locaiton to study the features from all of the angles.
Relevant Case Studies
- Springs Limestone Fractures
- Panama Canal Boat-Towed 3D Resistivity Surveys
- Construction Aggregate Mining: Sand & Gravel
- Searching For Potential Unmarked Graves Near San Antonio, Texas
- Scanning For Leaks & Sinkhole Detection In A Retention Pond
- Looking For Potential Caves & Voids Along Proposed Pipeline Path
- Mapping Sand Unit Thickness For Construction Aggregate In North Carolina
- Landslide Investigation In Turkey
- 3D Heap Leach Monitoring
- 3D Sea Side Lithology Mapping