- Office Hours: M-F 8:30 AM - 5:00 PM
Septic systems are underground, independent wastewater treatment structures consisting of a septic tank and leach field. The tank digests organic matter and separates floatable matter from the wastewater and the liquid effluent flows from the septic tank into a series of perforated pipes buried in a leach field. The installation of a residential septic system requires a subsurface investigation—typically involving test pits—to ensure sufficient drainage of the leach field.
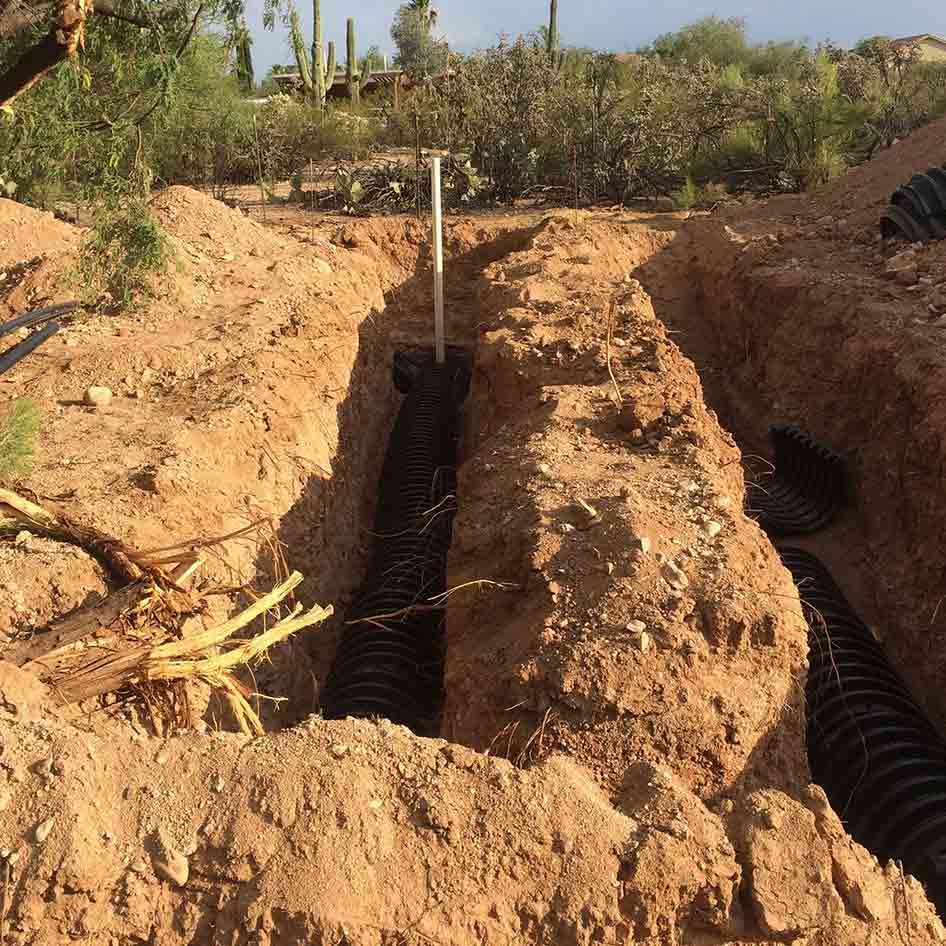
Above: Test trench or test pit for the septic system
In Arizona, at least one of the following American Society for Testing Materials (ASTM) methods should be used: D5921-96E1 (ASTM, 2003) and D1452-80 (ASTM, 2000); percolation testing; or seepage pit performance testing (AAC, 2005). The Arizona code also provides a means to conduct other tests that ensure compliance with water quality standards.
Although not listed by the code as a testing procedure, electrical geophysical methods increase the likelihood of finding test pit locations with a suitable infiltration rate—lowering the costs associated with digging. This method also gives a broader understanding of the sites subsurface conditions such as subsurface flow directions.
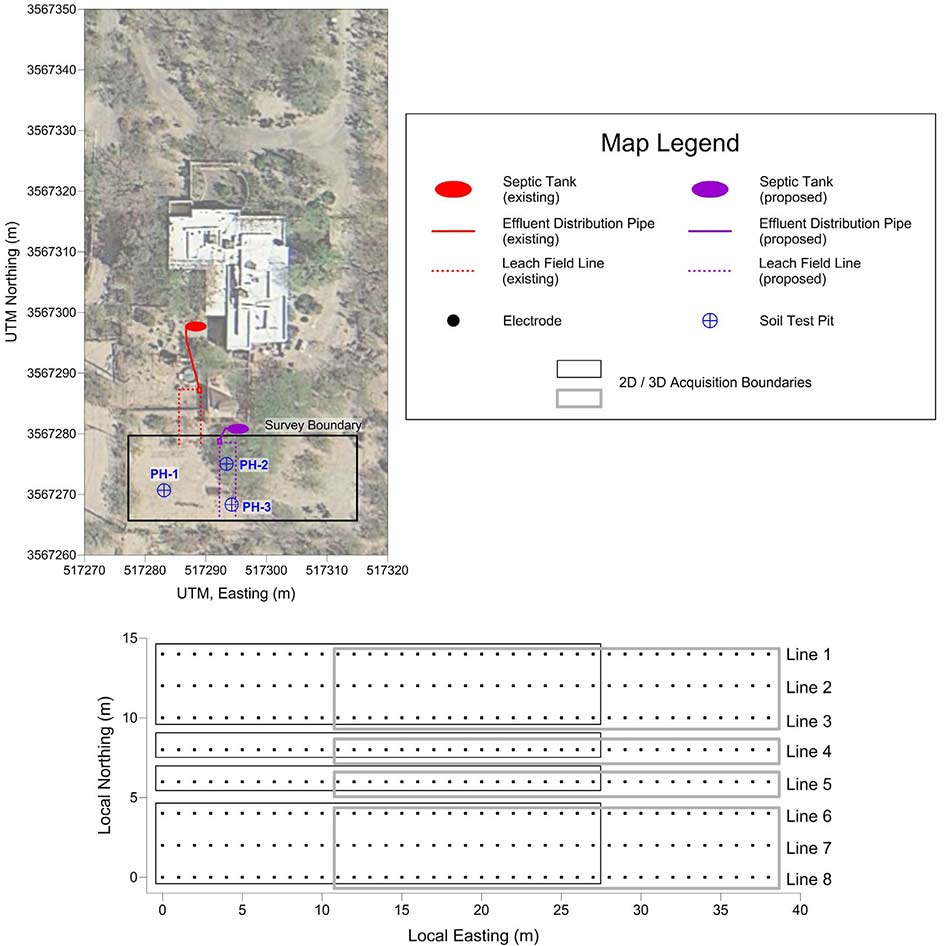
Figure 1 - Geophysical survey details across a residential lot to site a proposed septic leach field.
An electrical resistivity and IP survey was conducted on a portion of a residential property to map a suitable location for a septic leach field. Data were collected with the SuperSting™ R8 multi-channel resistivity/IP meter with a SwitchBox84®. For the survey, eight parallel lines were positioned 2 m apart, with an inline electrode spacing of 1 m. Data were acquired in groups of 28 electrodes in both inline and crossline geometries. Figure 1 shows the layout of the survey area. Lines 1 through 3 and lines 6 through 8 were acquired in a group, where 84 electrodes were used simultaneously in both inline and cross line 3D geometry. Lines 4 and 5 were acquired using 2D inline measurements. With 28 electrodes spaced 1 m apart, the expected depth of investigation is about 5 m, far below what is needed for site testing for septic placement.
To map the entire site, individual lines were picked up and overlapped by 17 electrodes (~40%). Once completed, all of the data were combined into a single three-dimensional tomographic inversion model. Prior to acquiring all of the data across the Tucson Basin site, tests were run to determine the best acquisition strategy that would have sufficient resolution to map the soils. The test lines were placed at the beginning portion of Line 4 using arrays generated with the AGI Administrator Software including the dipole-dipole with a maximum n-spacing of 8 and all a-spacing values, Inverse Schlumberger (a reciprocally equivalent Schlumberger that maximizes efficient multi-channel acquisition), and the edge gradient array generated with AGI EarthImager™2D.
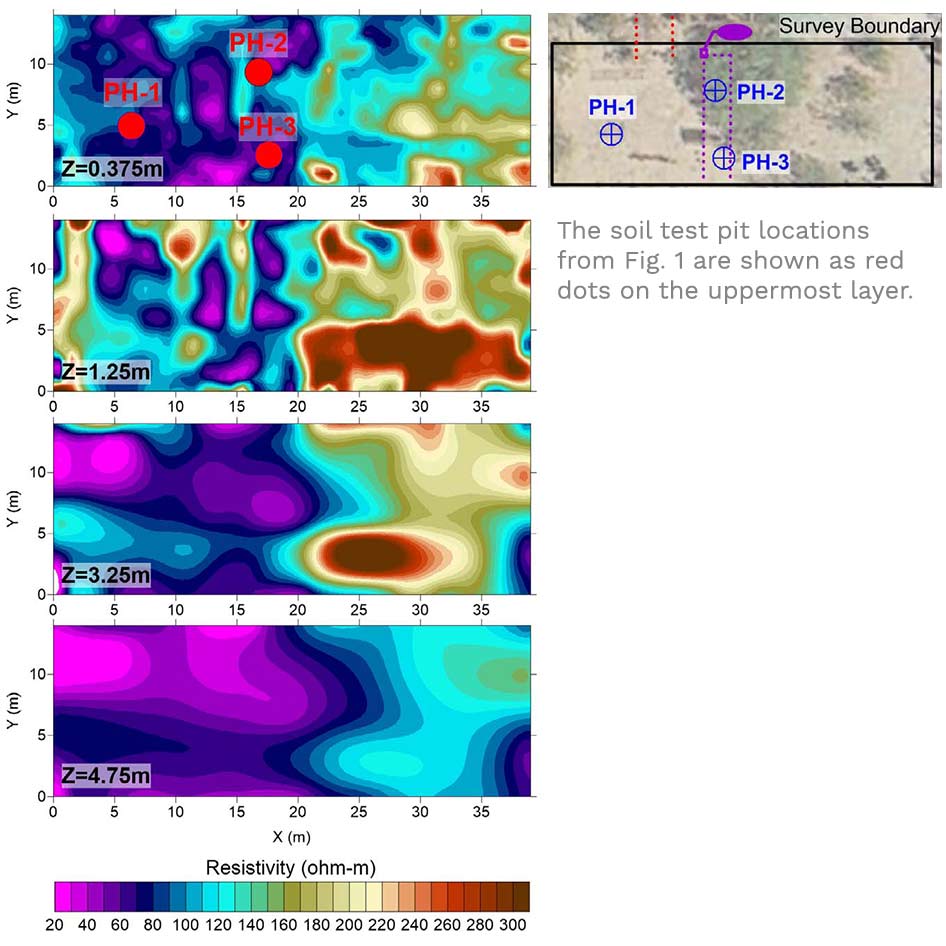
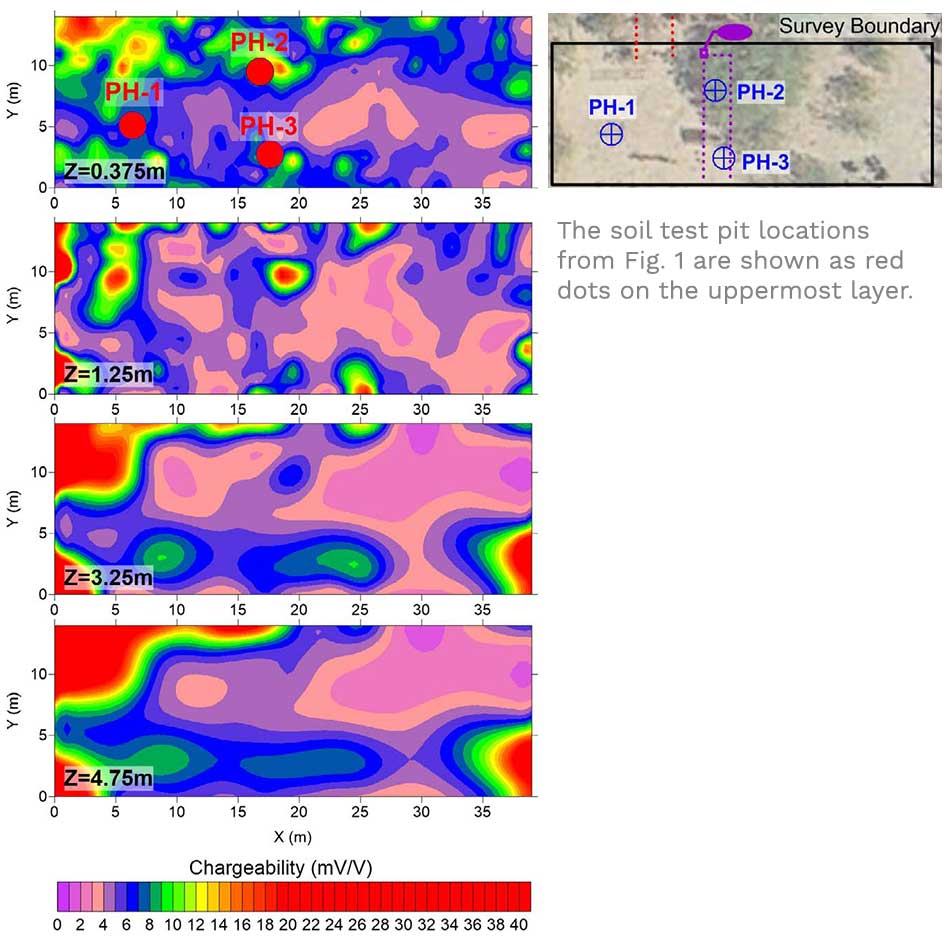
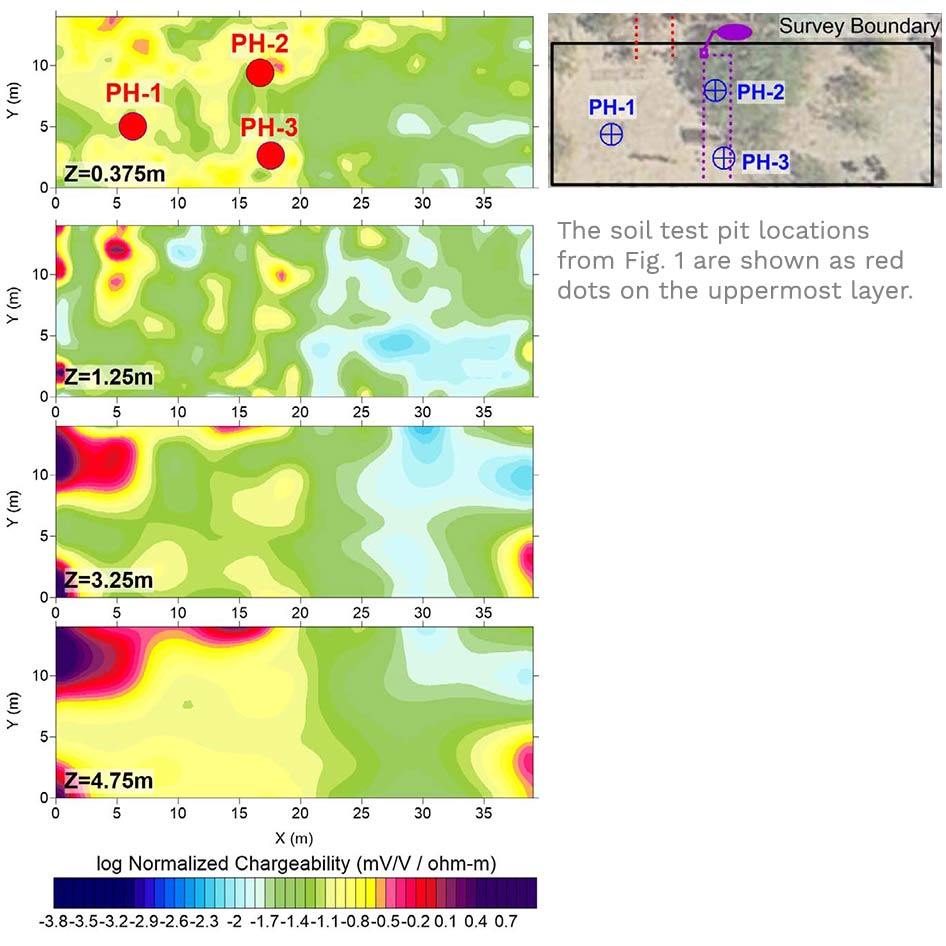
Figure 2 - Inverse modeling results of resistivity, chargeability, and normalized chargeability using a decay curve filter of r2>0.9. The results are presented as horizontal slices through the 3D model. The soil test pit locations from Fig. 1 are shown as red dots on the uppermost layer.
Figure 2 shows the results of the inversion for r2>0.9, where the final root mean square error (RMSE) between modeled and measured data was 3.73% and 2.06% for the resistivity and chargeability, respectively. These low RMSE values were obtained from the fifth iteration. The modeled results are presented as horizontal slices through the 3D volume with the location of the test pits presented on the slices for reference. The resistivity data show conductive material in the west and resistive material in the east with little vertical variability. The resistive material fits the observation of Orthid soils with higher caliche, and conductive material aligning with Argid soils.
The IP data shows a similar pattern, where high chargeability is associated with clayey soils on the west. The normalized chargeability is a plot of chargeability divided by resistivity and logarithmically transformed. Per Revil et al. (2020), ‘‘normalized chargeability denotes the ability of porous materials to store reversibly electrical charges in an applied electrical field generating polarization phenomena that are non-dielectric in nature and observable at low frequencies’’.
Very low values of normalized chargeability are characterized by low chargeability and high resistivity, again coincident with Orthid soils. The high end of the scale, which is restricted to deepest part of the model in the west, is characterized by high chargeability and low resistivity. The midrange values are mostly in the shallower soils on the west side of the property.
The results of the study showed that the resistivity method could differentiate between what was likely a paleo channel running through the west side of the property from caliche-rich soils on the east. The chargeability was also higher on the west side suggesting that perhaps slow moving water allowed settlement of finer grained clayey sediments. Test pits dug to about 3.65 m at three locations showed similar soil structure as resolved by the geophysical results.
The two pits in the center of the survey are the best sites for the septic leach field given moderate to low chargeability that suggests a loam to loamy sand soil.
These results show that electrical resistivity and IP imaging can reduce the number of time-consuming and expensive invasive tests needed during septic design. In this example, the resistivity and IP images show very similar structure between the eastern and western halves of the property. However, both datasets are necessary to ensure that moisture content—a dominant controlling factor for resistivity—was not solely responsible for the lack of variance.
IP images were used to locate test pits which then verified that clay percentage was higher in the west. This location was then eliminated from possible locations for the leach field. These results suggest that resistivity and IP images can help reduce the number of test pits needed to find the best location for the drain field.
Data & Survey Details courtesy of: hydroGEOPHYSICS Inc., W.K. Walker, P.E., and Advanced Geosciences, Inc.
Official Release of Full Case History: JEEG June 2021, Volume 26, Issue 2.


