- Office Hours: M-F 8:30 AM - 5:00 PM
According to data from the Spanish Ministry of Agriculture, Fishing and Food (MAPA, 2020) in Spain, the pig activity sector accounts for 39% of all the livestock activity—placing Spain fourth in the world in terms of intensive pig production. This remarkable livestock activity means the establishment of all sort of auxiliary industry and considerable revenues. However, it poses a serious impact to the environment due to the generation of different sub-products such as pig slurry, CO2 gases, etc.. Pig slurry is the residual material formed from solid and liquid animal wastes, water from drinking trough overflow, and the cleaning works of stables.
National and Regional governments have passed new regulations for the construction of farms to reduce the impact of the livestock activity to the environment. However, there are many old farms that continue with the storage of pig slurry in ponds that are not sealed with lining or concrete to avoid the filtration of the slurry to the subsurface. Therefore, farmers need insight into the actual impact of those pig slurry ponds into the subsurface and their precise degree of impact to the near-surface aquifers.
The electrical resistivity tomography (ERT) technique played a relevant role in achieving appropriate findings. This was especially true since the pig slurry is mostly water with a high content of organic solid particles, composed of anions and cations such as NH4+, Cl-, SO42-, Na+, K⁺, Ca2⁺, and Mg2+, forming salts that increased the pig slurry detection into the subsurface using the ERT technique.
The primary objective of using the electrical resistivity imaging technique was to see through the impervious degree of soils to track and avoid the progress of slurry into the subsurface—and potentially affect the aquifers. To conduct this study, the equipment used was a Supersting™ R8 Resistivity/IP/SP meter and the EarthImager™ 2D/3D modeling software for the post processing of electrical resistivity data gathered from the subsurface.
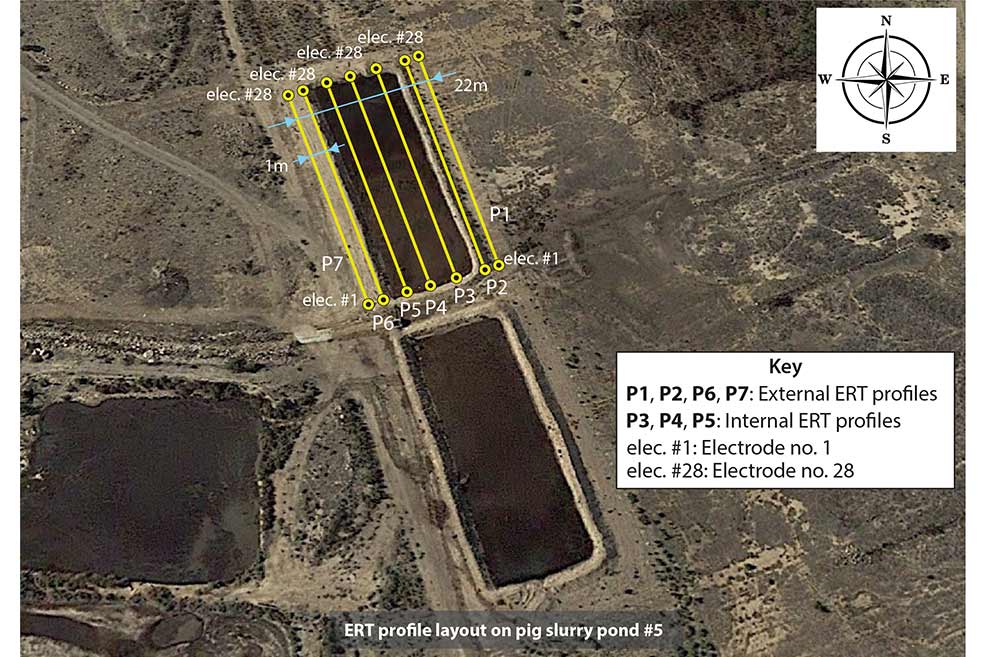
Eight slurry ponds were selected to undertake this study which were representative of the type of slurry ponds present in the region. Moreover, because some ponds had slurry during the electrical surveys, it was needed to establish an appropriate layout for the planned internal ERT profiles, three internal ERT profiles in total. The internal layout was accomplished using a AGI marine cable composed of 28 take-outs with a spacing of 1 or 2 meters. On the other hand, for the external measurements it was used the common AGI cable for ground measurements, also with a spacing of 1 or 2 meters between take-outs. So, for each slurry pond surveyed a total of 5-7 parallel ERT profiles were conducted, three internal profiles and two/four external profiles, depending on the pond geometry and its shape. The electrical data were recorded using the Dipole-Dipole array.
The 2D/3D ERT profiles clearly defined two near-surface zones of different electrical resistivity characteristics. The lateral region and immediately close to the slurry pond, which was characterized by external ERT profiles, showed higher resistive values ranging between 50 and 100 Ohm-m. Differently, the region under the slurry pond, which was characterized by internal ERT profiles, showed resistive values between 1 and 4 Ohm-m.
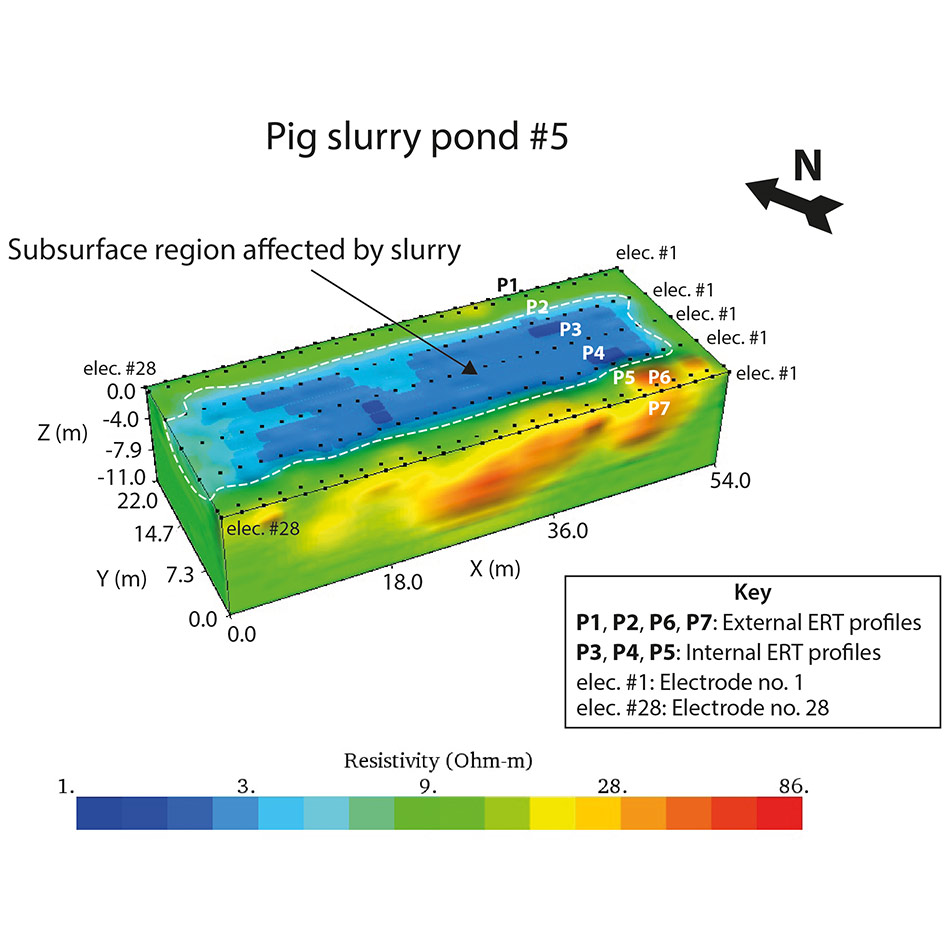
The highest resistivity values obtained from the external ERT profiles are attributed to layers of cemented conglomerate, caliche, and unsaturated granular material identified by drilling rigs. On the contrary, lower resistivity values obtained from the internal ERT profiles infer the presence of salty pig slurry underneath the slurry pond to a depth of approximately 3 meters depth. It is concluded that the ERT technique has been shown as a remarkable tool to determine the actual influence of pig slurry into the subsurface. The latter has been confirmed by drilling core analyses. Also, it is needed to highlight that this study is still progressing as time-lapse ERT measurements will be undertaken in different seasons and with the slurry ponds under different circumstances such as empty, dried, or completely full of slurry.
References: Spanish Ministry of Agriculture, Fishing, and Food. MAPA (in Spanish, Ministerio de Agricultura, Pesca y Alimentación). 2020. https://www.mapa.gob.es/en/ganaderia/temas/default.aspx
Data and Survey Details Courtesy of: Martínez-Pagán, P.; Martínez-Segura, M.A.; Faz, A.; Capa-Camacho, X.; Gabarrón, M. Department of Mining and Civil Engineering. Universidad Politécnica de Cartagena (Spain). www.upct.es


