- Office Hours: M-F 8:30 AM - 5:00 PM
The Ozark Mountains are plateaus with few folds or faults that are lifted as units and have been eroded by rising and falling rivers. The terrain is dominated by steep hill slopes with slope angles ranging from 10 degrees to 30 degrees. The slope area that was surveyed is moving westward and has caused a number of cracks to form in the pavement near the area—which has to be periodically repaired. Interbedded shale and sandstone layers make up the bedrock system within the study area. The primary objectives of this study was to delineate the clay/bedrock interface and to gain insight into how expansive clays, the structure of the bedrock, and high-water saturation are influencing slope movement.
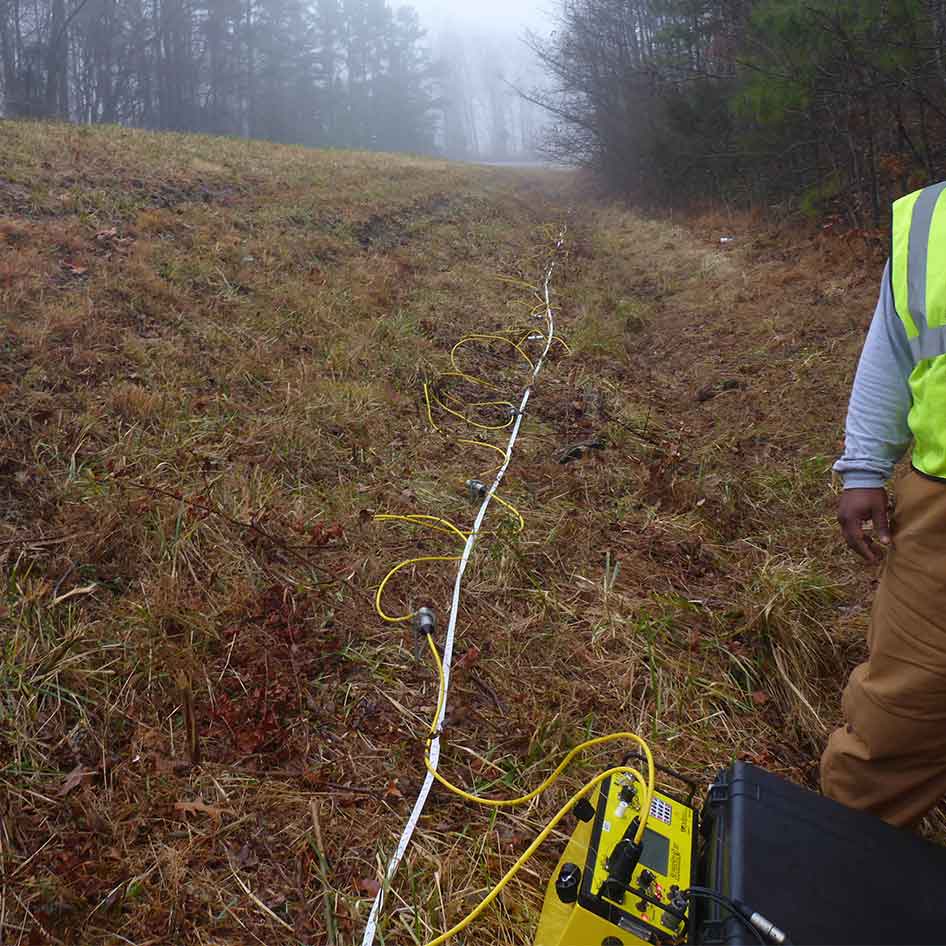
The client used a Supersting™ R8 Resistivity/IP/SP meter and EarthImager 2D™ modeling software for this project. Three ERI surveys were conducted parallel and perpendicular to the unstable slope. An electrode spacing of either 0.91 or 1.52 m was used to conduct all surveys. A 56 electrode merged Dipole-Dipole and Strong Gradient array was used to collect all datasets. This optimized array provides better coverage of the subsurface and a higher signal to-noise ratio than the Dipole-Dipole array alone (Reference: *Stummer, P., H. Maurer, and A. G. Green, 2004, Experimental design: Electrical resistivity data sets that provide optimum subsurface information: Geophysics, 69, 120-139).
The two inversion model goodness of fit statistics used were the root mean square error (RMS) and the L2-norm. The estimated data noise is used to set the stopping criteria and model regularization. A good inversion is produced when the RMS falls below the estimated data noise, and when the L2-norm approaches 1.0 while keeping within 8 iterations.
The client’s final models had a max ohm-m value is 3500. The final figures use a color scale that is compressed to 200 ohm-m to emphasize the clay/bedrock contact and to illustrate comparisons to the available borehole record.
A sharp resistivity contrast was located across the approximate slide boundary allowing for a clear picture of the slide footprint. Areas of high water saturation that are subject to slides were also mapped. ERT results were supported by nearby direct borehole and inclinometer data and provide a good geologic framework to facilitate an improved slope stability model.
Data & Survey Details courtesy of: PhD for Kansas State University, Department of Civil Engineering, Weston J Koehn, et al.